
Figure 5. Kaplan–Meier DFS and OS curves based on PD-L1 immunohistochemistry status and the distribution for the potential therapeutic targets detected in SqCLC.
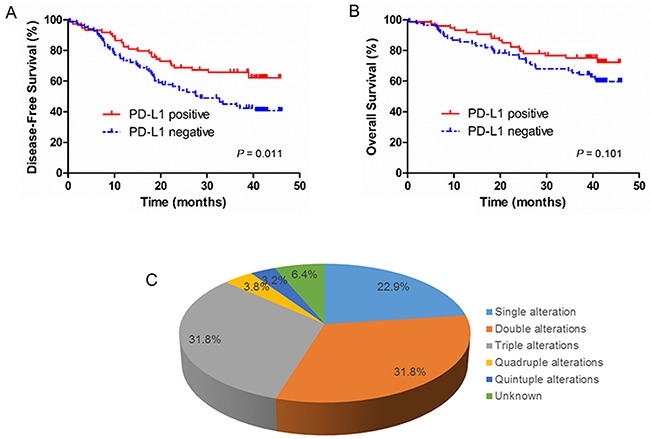
A. Disease free survival (DFS) rates of SqCLC patients by PD-L1 expression status; B. Overall survival (OS) rates of SqCLC patients by PD-L1 expression status. C. The pie chart demonstrated the distribution for the potential therapeutic targets detected in SqCLC.