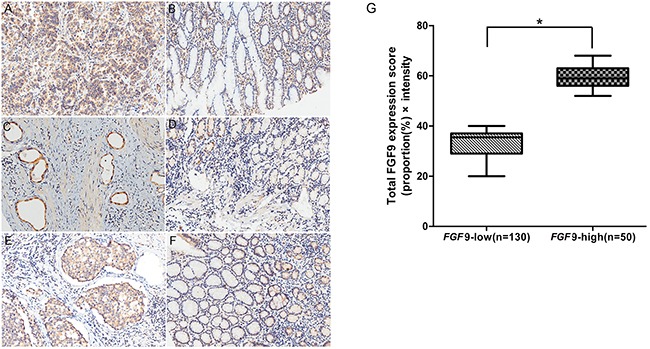
Figure 2. Immunohistochemical analysis of FGF9 expression and survival curves in patients with GC according to FGF9 levels.

A. High FGF9 expression in gastric adenocarcinoma and low expression in corresponding non-cancerous gastric tissues B. High FGF9 expression in gastric adenocarcinoma, part of signet-ring cell carcinoma and low expression in corresponding non-cancerous gastric tissues C. and low FGF9 expression in corresponding non-cancerous gastric tissues D. High FGF9 expression in gastric tubular adenocarcinoma E. and low FGF9 expression in corresponding non-cancerous tissues F. The total FGF9 expression score was calculated by multiplying the proportion (%) of cells expressing FGF9 with the intensity score described in Methods. The thick line indicates the median score in each group G. *P < 0.001, FGF9-low group vs. FGF9-high group (Mann–Whitney U-test).
