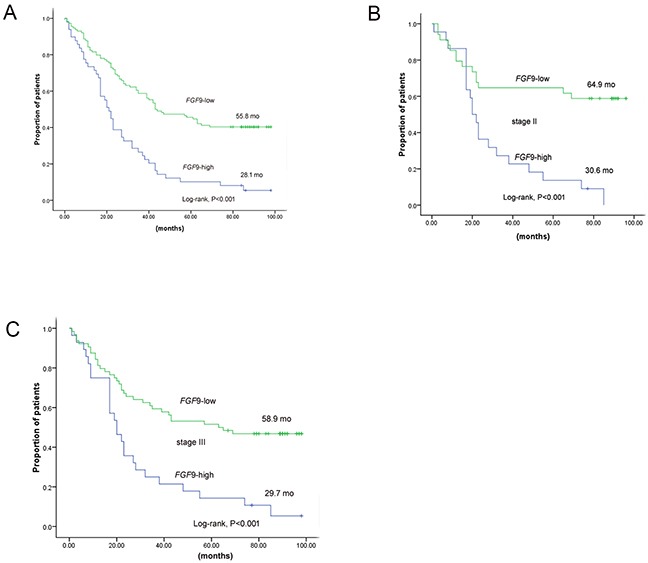
Figure 3. The prognosis of GC patients with high expression of FGF9 and low/unchanged expression of FGF9.

A. Kaplan–Meier curves of 163 GC patients according to FGF9 expression. B. Kaplan–Meier curves of 56 GC patients according to FGF9 expression in stage II. C. Kaplan–Meier curves of 92 GC patients according to FGF9 expression in stage III. *P < 0.001 (log-rank test).
