
Figure 2. MiR-507 directly targets Flt-1, and Overexpression of miR-507 in breast-cancer cells inhibits invasion.
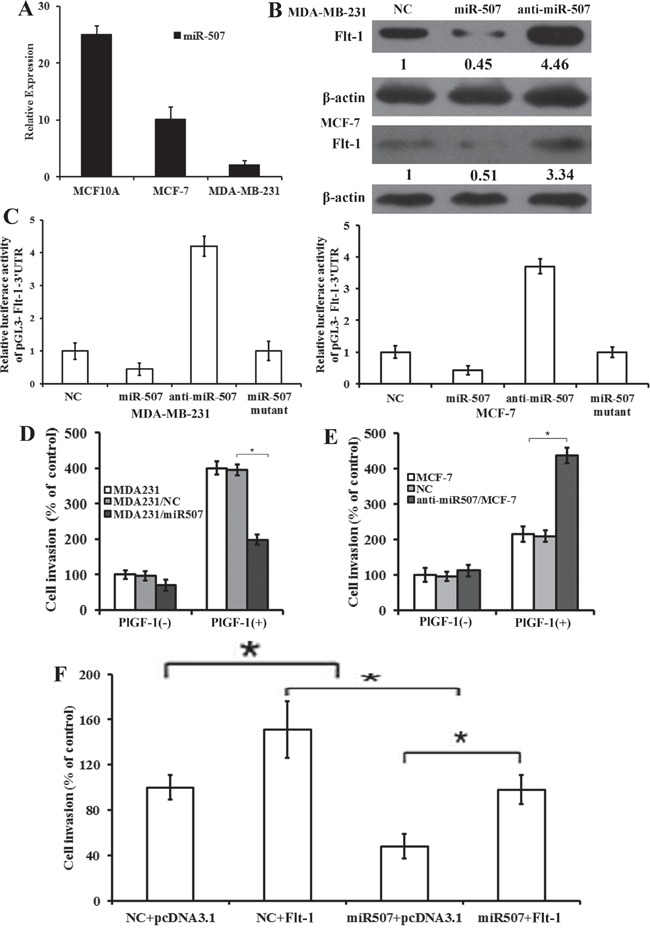
A. Expression of miR-507 in breast-cancer cell lines through qRT-PCR analysis. Columns, mean of triplicate measurements. Bars, standard deviation. B. Western blot analysis of Flt-1 expression in MDA-MB-231 and MCF-7 cells transfected with miR-507 and miR-507 inhibitor. β-actin was used as control. Quantification of relative protein levels in three different Western blots is shown below the blots. C. Luciferase activity of pGL3-Flt-1-3′UTR reporter in indicated cells co-transfected with oligonucleotides. D. Quantification of PlGF-1-induced penetrated cells were analyzed in MDA-MB-231, MDA231/NC, and MDA231/miR507 cells through transwell invasion assay. rPlGF-1, 10 ng/mL. Columns, mean of triplicate measurements. Bars, standard deviation. * P <0.05 (two-way ANOVA). E. Quantification of PlGF-1-induced penetrated cells was analyzed in MCF-7, NC, and anti-miR507/MCF-7 cells through transwell invasion assay. rPlGF-1, 10 ng/mL. Columns, mean of triplicate measurements. Bars, standard deviation. * P <0.05 (two-way ANOVA). F. Quantification of PlGF-1-induced penetrated cells were analyzed in indicated cells through transwell invasion assay. rPlGF-1, 10 ng/mL. Columns, mean of triplicate measurements. Bars, standard deviation. * P <0.05 (two-way ANOVA).