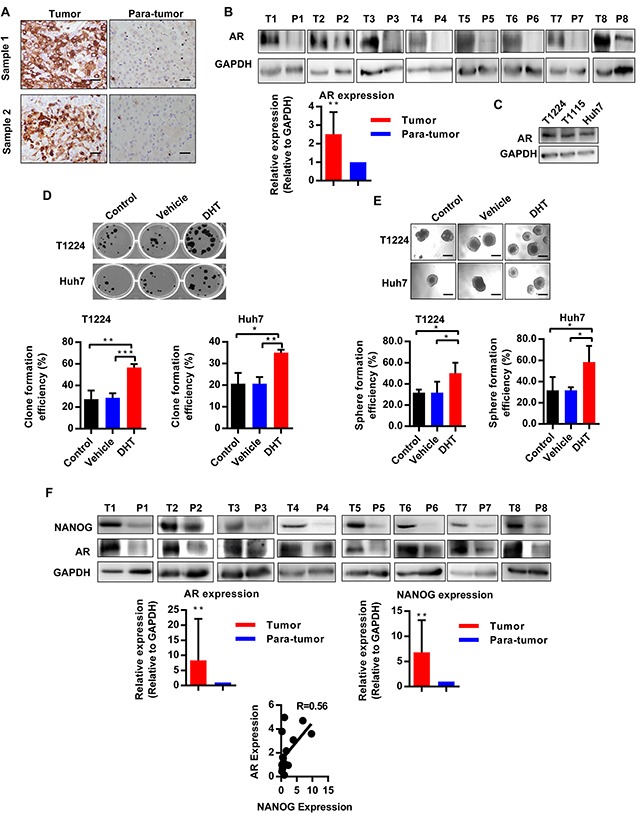
Figure 1. AR is highly expressed in hepatocarcinoma and is associated with expression of Nanog.

A. Immunohistochemical staining of AR expression in hepatocarcinoma and peritumoral tissues (para-tumor). Scale bars, 100 μm. B. Western blotting analysis the expression of AR in hepatocarcinoma (T) and corresponding peritumoral (P) tissues, GAPDH as the internal reference, n=8. C. AR expression in HCC cells T1224, T1115 and Huh7. D-E. Clone and sphere formation efficiency of HCC cells after treatment with DHT, or DMSO as vehicle. Data was presented as means ± SD of three independent experiments. F. Nanog and AR expression in hepatocarcinoma (T) and corresponding peritumoral (P) tissues. The data showed 8 pair out of 16 pairs. R value is correlation of AR and Nanog expression under correlation analysis by gray value normalized to GAPDH, n=16. p<0.05(*), p<0.01(**) and p<0.001(***).
