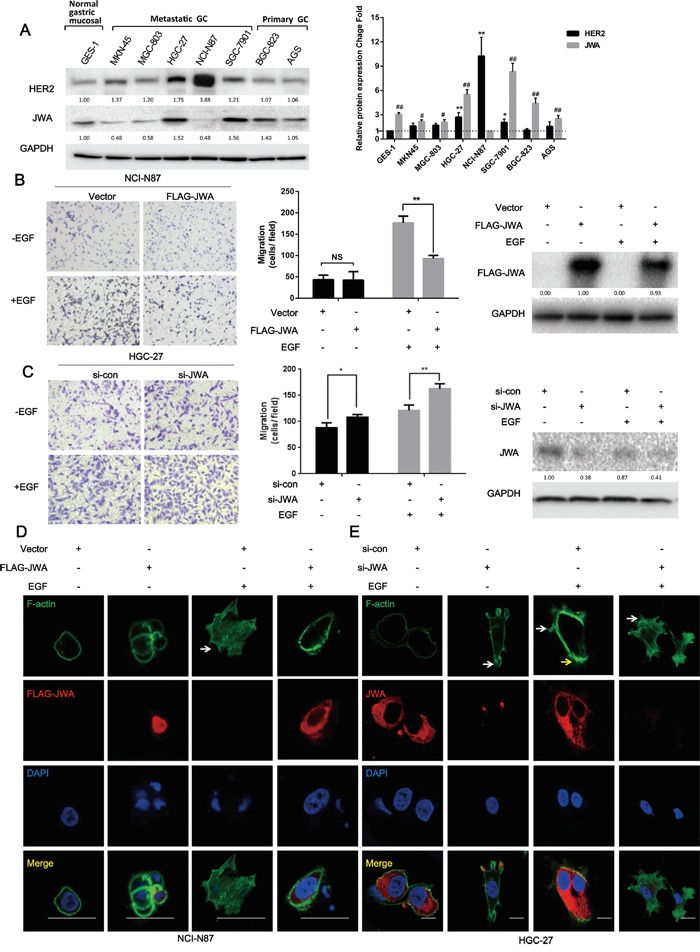
Figure 1. JWA inhibits cell migration and actin cytoskeletal rearrangement in HER2-overexpressing gastric cancer cells.

A. Expression of JWA and HER2 in gastric cancer (GC) cell lines and normal gastric mucosal cells. (Left panel) Equal amounts of protein from five metastatic GC cell lines (MKN-45, MGC-803, HGC-27, SGC-7901, and NCI-N87), two primary GC cell lines (BGC-823 and AGS) and normal gastric mucosal epithelial cells (GES-1) were evaluated by immunoblotting to detect JWA, HER2 and glyceraldehyde 3-phosphate dehydrogenase (GAPDH). (Right panel) The intensity of the JWA and HER2 protein bands in the 8 cell lines were analyzed by densitometry and normalized to GAPDH. The fold change in expression of each protein is expressed as a grey value ratio of each group to the control group with the lowest value among 8 cell lines. The data are plotted as the mean ± standard deviation (SD) of 3 independent replicates. Two-tailed Student's t-test; * P<0.05 and ** P<0.01 compared to the GES-1 group; # P<0.05 and ## P<0.01 compared to the NCI-N87 group. B, C. NCI-N87 cells overexpressing JWA or the respective vectors (B) and HGC-27 cells transfected with JWA siRNA or scramble control (C) were seeded into the upper compartments of transwells in the absence or presence of 100 ng/ml EGF for 24 h after a 12-h serum starvation. (Left panel) The panels show images at 100x of NCI-N87 and HGC-27 cells on the lower surface of the transwells. (Middle panel) The number of cells on the lower surface of the transwells was counted in five random fields. Error bars indicate the S.E.M. of three independent experiments in triplicate. Two-tailed Student's t-test; * P<0.05 and ** P<0.01. (Right panel) The expression of JWA was determined by western blot analysis. D, E. Phalloidin-FITC staining was performed to observe F-actin stress fibers in JWA-overexpressing NCI-N87 cells (D) and JWA-silenced HGC-27 cells with their corresponding controls (E). Scale bar, 100 μm.
