
Figure 6. JWA is negatively associated with HER2 expression in gastric cancer (GC) tissue, and low JWA predicts a poor prognosis and stratifies a high-risk subgroup of HER-2-positive advanced gastric cancer (AGC).
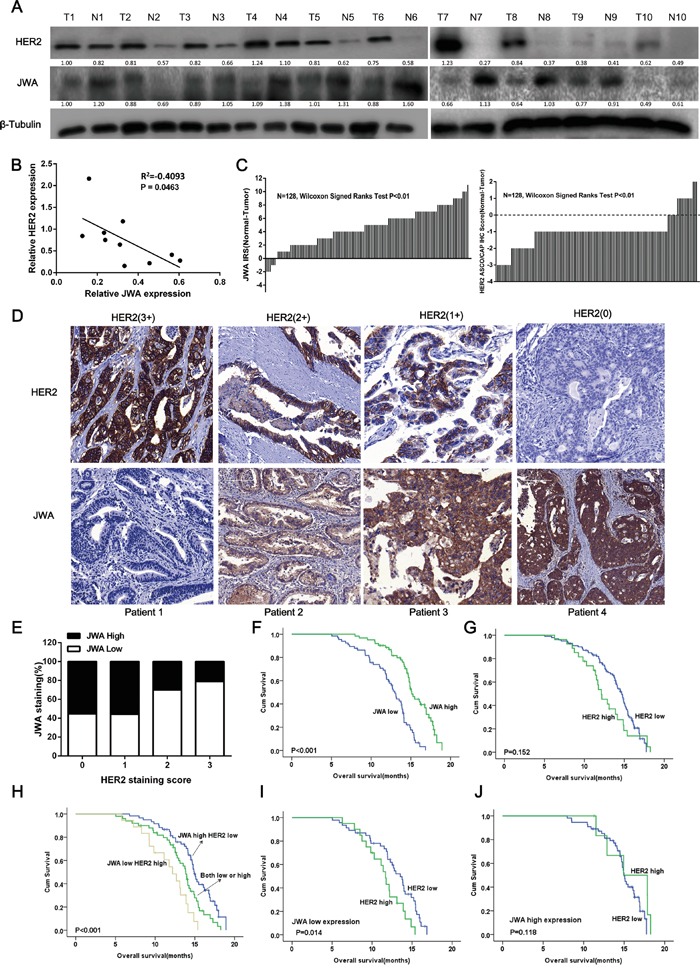
A. Gastric cancer tissues and adjacent noncancerous normal gastric tissues from 10 different patients were lysed. The lysates were probed for JWA and HER2. β-Tubulin was used as a loading control. B. Correlation analysis of the relationship between relative JWA protein expression and relative HER2 expression in 10 GC tissues. C. The distribution of the JWA and HER2 staining scores. JWA and HER2 expression was examined by IHC in 128 paired human GC and adjacent normal tissues (Wilcoxon's signed-rank test, P<0.01). The data are presented as the difference between the noncancerous score and the paired cancer score (including the JWA IRS and the HER2 ASCO/CAP IHC score). D. Representative images of JWA and HER2 immunohistochemical staining in human gastric cancer lesions with different HER2 scores. Scale bars, 100 μm. E. The negative rate of JWA across all HER2 scores (n=128, Chi square test, P<0.01). F-J. Kaplan–Meier analysis of the overall survival (OS) of AGC patients based on JWA (F, high JWA expression, n= 62; low JWA expression, n= 66), HER2 (G, high HER2 expression, n= 27; low HER2 expression, n= 101) or combined JWA/HER2 (H, high JWA/low HER2, n= 52; both high or both low, n= 58; low JWA/high HER2, n= 18). P values were calculated using the log-rank test. I, J. Kaplan-Meier plot illustrating the OS based on HER2 expression of AGC patients with high JWA expression (I) or low JWA expression (J).