
Figure 7. ERα is required for E2 upregulated-AKT2 expression, which can be inhibited by miR-124 in ERα-positive BC cells.
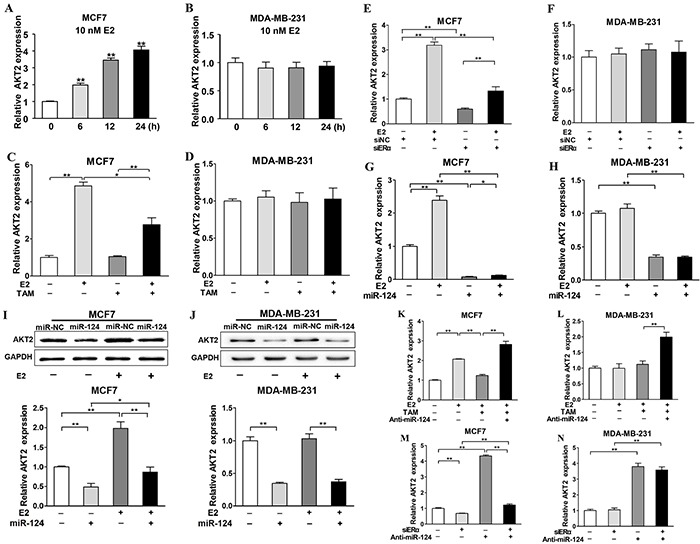
A. and B. MCF7 and MDA-MB-231 cells were cultured as above and treated with E2 for 0, 6, 12 and 24 h. The relative AKT2 expression of each group was analyzed by qRT-PCR and represented the ratio to control group. Data were presented as the means ± SD from three independent experiments with triple replicates per experiment. ** indicates significant difference compared to control at P < 0.01. C. and D. TAM was used as the E2 antagonist and the expression levels of AKT2 were analyzed by qRT-PCR. Data were presented as the means ± SD from three independent experiments with triple replicates per experiment. * and ** indicate significant difference between two groups with P < 0.05 and P < 0.01, respectively. E. and F. Cells were cultured and treated as in Figure 2E, the expression levels of AKT2 were analyzed as above. Data were presented as the means ± SD from three independent experiments with triple replicates per experiment. ** indicates significant difference between two groups at P < 0.01. G. and H. The cells were cultured as above and the expression levels of AKT2 were determined by qRT-PCR in miR-124- and miR-NC-overexpressing cells without or with E2 treatment for 24 h using GAPDH levels as internal control, and normalized to the value of Eth control. Data were presented as the means ± SD from three independent experiments with triple replicates per experiment. * and ** indicate significant differences between two groups with P < 0.05 and P < 0.01, respectively. I. and J. The expression levels of AKT2 and GAPDH were determined by immunoblotting in miR-124- and miR-NC-overexpressing cells without or with E2 treatment for 48 h. The densities of AKT2 were quantified by Image J software and GAPDH levels were used as internal control, and normalized to the values of Eth control. Data were presented as the means ± SD from three independent experiments with triple replicates per experiment. * and ** indicate significant differences between two groups with P < 0.05 and P < 0.01, respectively. K. and L. MCF7 and MDA-MB-231 cells were cultured as above and transfected with siRNAs, and divided in four groups including siNC+Anti-miR-NC, siERα+Anti-miR-NC, siNC+Anti-miR-124, siERα+ Anti-miR-124 group. After 24 h, the expression levels of AKT2 were determined by qRT-PCR using GAPDH levels as internal control, and normalized to the values of siNC+Anti-miR-NC group. Data were presented as the means ± SD from three independent experiments with triple replicates per experiment. ** indicates significant difference between two groups at P < 0.01 M. and N. Cells were cultured as above and transfected with Anti-miR-NC or Anti-miR-124. After 24 h, the cells were treated with or without 10 nM E2 and 100nM TAM for 24 h. The expression levels of AKT2 were determined by qRT-PCR using GAPDH levels as internal control, and normalized to the values of Eth+Anti-miR-NC group. Data were presented as the means ± SD from three independent experiments with triple replicates per experiment. ** indicates significant difference between two groups at P < 0.01.