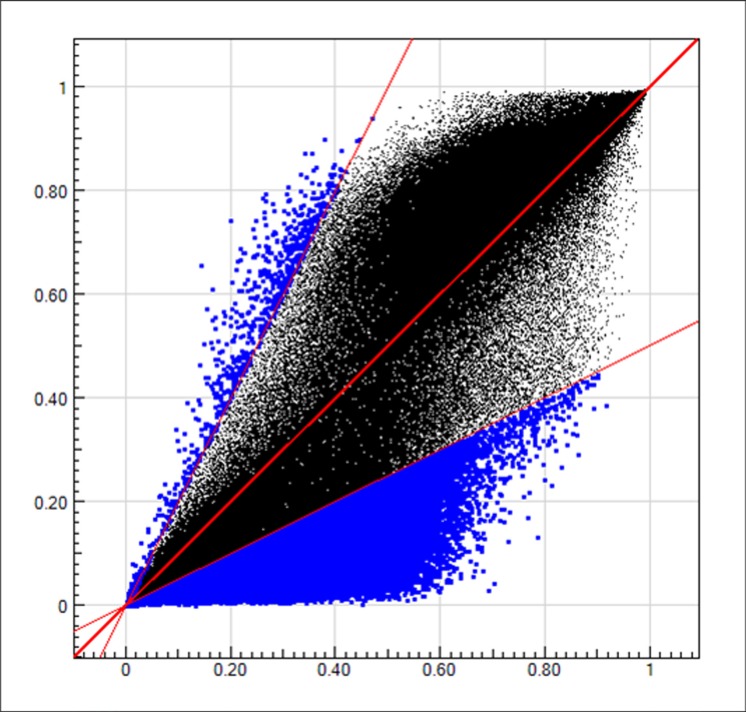
Figure 1. The methylation levels in gastric mucosa and blood leukocyte DNA.
The blue dots in upper left region represent the CpGs with (methylation level in gastric mucosa)/(methylation level in blood leukocytes) ≤ 0.5. The blue dots in lower right region represent the CpGs with (methylation level in gastric mucosa)/(methylation level in blood leukocytes) ≥ 2. The black dots in the middle region represent the CpGs with (methylation level in gastric mucosa)/(methylation level in blood leukocytes) > 0.5 and < 2.

