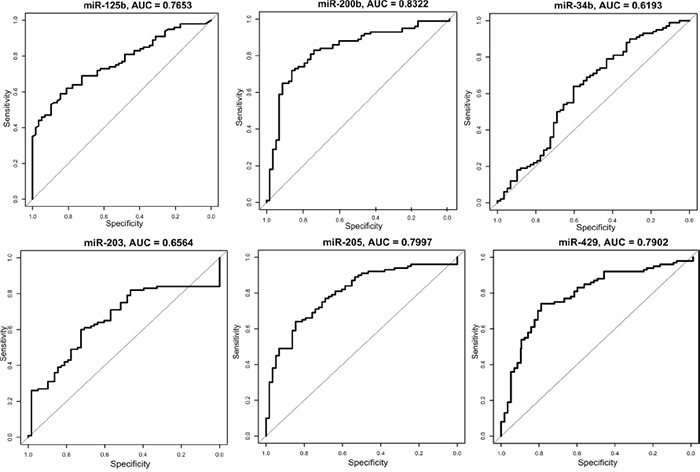
Figure 2. ROC curves for the 6 validated microRNAs analyzed in the validation set.

The plots show the sensitivity versus specificity. The area under the curves (AUC) is given for each microRNA.

The plots show the sensitivity versus specificity. The area under the curves (AUC) is given for each microRNA.