
Figure 4. Phosphorylation of E-cadherin at Thr-790 by PKCδ impairs the homophilic interaction of E-cadherin.
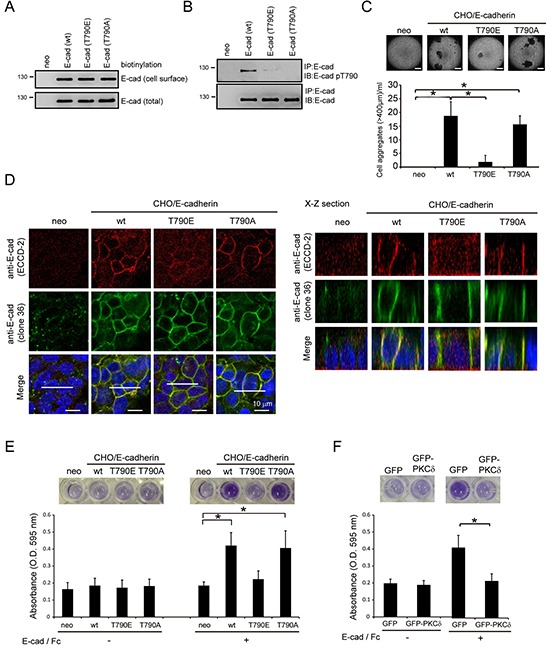
A. CHO cells stably expressing E-cadherin or its mutants (T790E and T790A) and their neomycin-resistant control cells (neo) were established by a lentiviral expression system. Those cells were subjected to biotinylation with sulfo-NHS-biotin. For measurement of the cell surface level of E-cadherin, equal amounts of cell lysates were incubated with avidin-immobilized agarose beads and then the complexes were analyzed by immunoblotting with anti-E-cadherin. For measurement of the total expression level of E-cadherin, equal amounts of cell lysates were analyzed by immunoblotting with anti-E-cadherin (clone 36). B. CHO cells, as in panel (A), were grown to confluence and then lysed. E-cadherin was immunoprecipitated by anti-E-cadherin (clone 36) and the immunocomplexes were analyzed by immunoblotting with antibodies to E-cadherin and E-cadherin pT790. C. CHO cells, as in panel (A), were collected by trypsinization, suspended in medium with 10% serum, and subjected to a constant rotation at 0.5 xg. Two days later, the number of cell aggregates 400 μm or larger in diameter was measured under a phase-contrast microscope. The values (mean ± SD) are from three experiments. *, P < 0.05. Representative micrographs of the cell aggregates were taken under a phase-contrast microscope. The scale bar represents 400 μm. D. CHO cells, as in panel (A), were grown to confluence and were then stained with anti-E-cadherin antibodies (clone 36 and ECCD-2). The scale bar represents 10 μm. The X-Z sections along the white lines were shown on the left. E. CHO cells (5×10⁵), as in panel (A), were suspended in serum-free medium and then plated onto a 96-well plate coated with or without purified E-cadherin/Fc chimera proteins composed of the extracellular domain of human E-cadherin (amino acids 1-707) fused to the Fc region of human IgG1. Two hours later, the cells were stained with MTT and the absorbance at 595 nm was measured. The values (mean ± SD) are from three experiments. *, P < 0.05. F. The adhesion of MDCK cells stably expressing GFP or GFP-PKCδ to purified E-cadherin/Fc chimera protein was analyzed as described in panel (E). The values (mean ± SD) are from three experiments. *, P < 0.05.