
Figure 2. Calibration curves for predicting patient survival at.
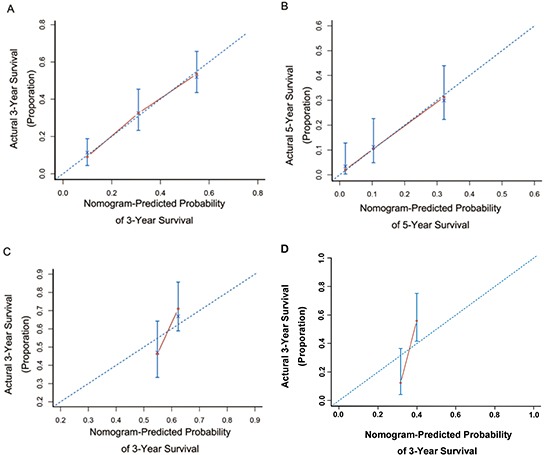
A. 3 years and B. 5 years in the primary cohort and at 3 years in the internal validation cohort C. or external validation cohort D. Nomogram-predicted probability of OS is plotted on the x-axis; actual OS is plotted on the y-axis.