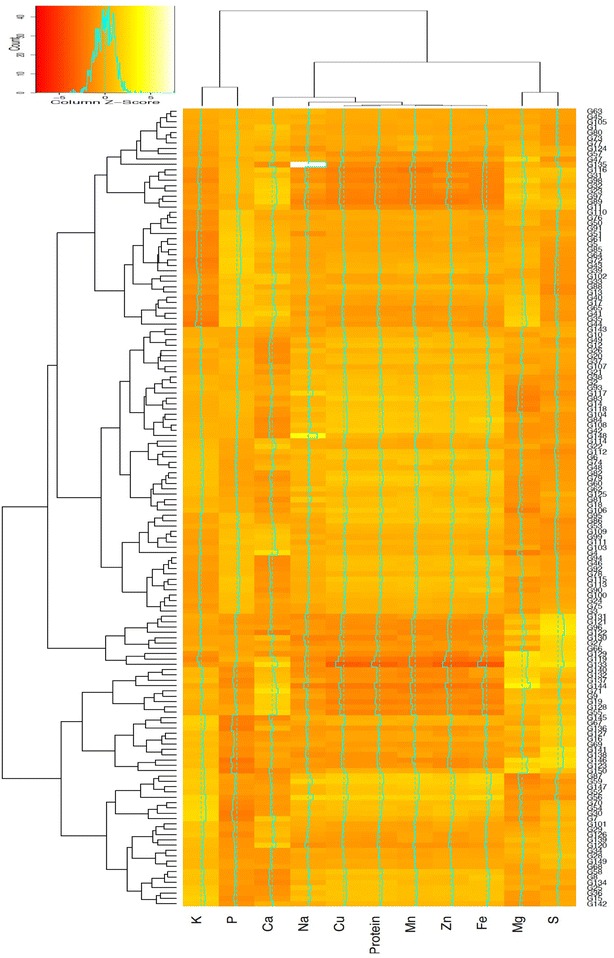
Fig. 4.

Heat-map and two-dimensional dendrogram of 121 Indian and 29 Turkish bread wheat genotypes for grain elemental and protein content. Dendrograms illustrate the relation between genotypes (rows) and nutrients (columns) using different color shades based on the average z-scores
