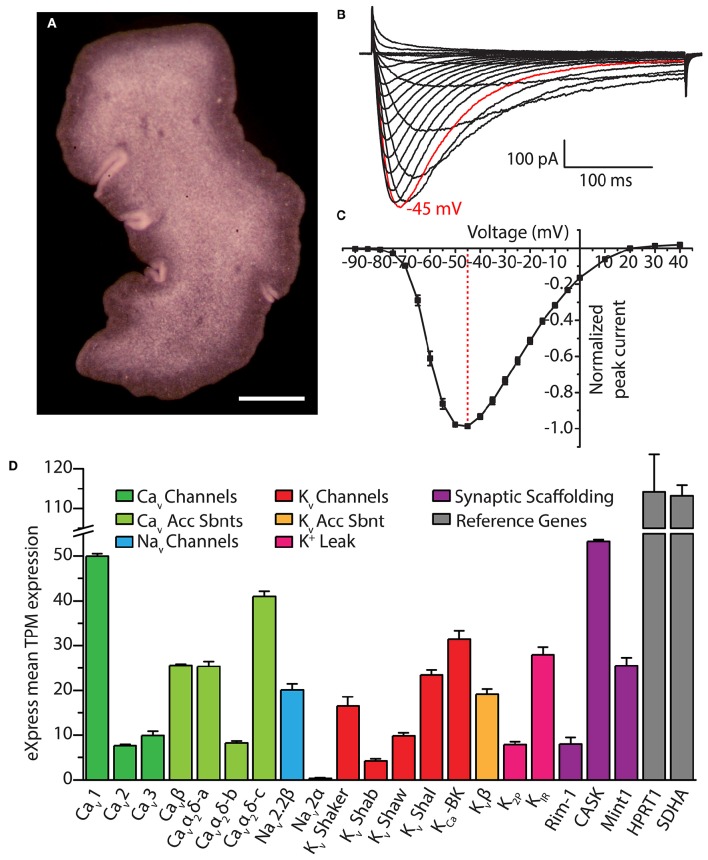
Figure 5.
(A) Dorsal view of Trichoplax adhaerens photographed through a stereomicroscope, revealing its irregularly-shaped body lacking symmetry outside of dorsal-ventral polarity. Gland cells are located in the ventral epithelium, most concentrated along the outside rim (i.e., within the darker band visible in the image). Scale bar is 200 μm. (B) Whole cell patch-clamp recorded Ca2+ currents of the cloned Trichoplax Cav3 channel expressed in HEK-293T cells, bearing rapid activation and inactivation kinetics, and a crossing over of current traces during inactivation with increasing depolarization (recorded in 2 mM external Ca2+ solution). (C) Current-voltage plot of average normalized peak inward Ca2+ current of Trichoplax Cav3, revealing its low voltage of activation with peak inward current at −45 mV (n = 10, error bars indicate SE from the mean). (D) Bar graph of mean mRNA expression levels of select Trichoplax ion channel genes and their subunits estimated with the program eXpress (Roberts and Pachter, 2013), quantified as transcripts per million (TPM) from assembled transcriptome data and four separate Illumina sequencing datasets of whole animal poly(A)-extracted mRNA (2x125 base pair reads; manuscript in preparation). Channels were identified via BLAST homology with mammalian protein sequences using an expect value cut-off of 1 x 10⁻⁵. Two ubiquitously expressed genes, Hypoxanthine Phosphoribosyltransferase 1 (HPRT1) and Succinate Dehydrogenase A (SDHA), are included as reference genes. Error bars indicate standard error from the mean TPM expression.

