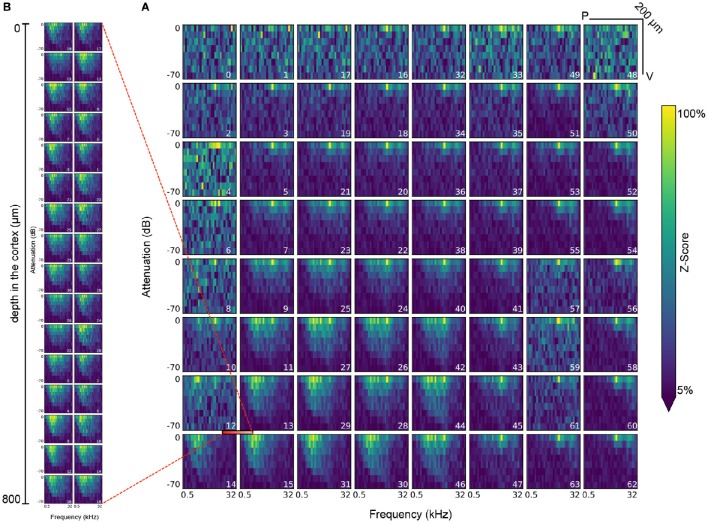
Figure 8.
Visualization of the response of all electrodes in the ECoG grid (A) and the polytrode (B) to tone stimuli at a frequency of 0.5 to 32 KHz and an attenuation of 0 to −70dB. The polytrode was inserted at the intersection of electrodes 12, 13, 14, and 15 in the μECoG grid (demarcated with red bar). Each plot represents a single electrode, while the index of the electrode as defined by the layout of the recording device is indicated in the bottom right of each plot. Each bin in a plot represents the mean of the z-scored response in the 25–50 Hz frequency band after each onset of a tone stimulus of the corresponding amplitude and frequency. Each stimulus is presented 20 times for 300ms each throughout the experiment.

