
FIGURE 4.
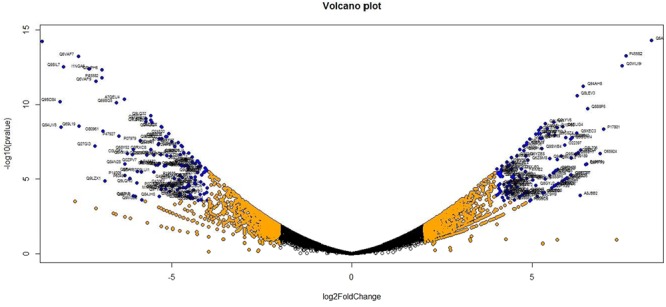
Volcano plot indicates the significance of DEGs to drought stress from drought-sensitive libraries. Log fold changes vs. p-values were plotted using R programming language. Different color schemes represent DEGs of significance. Red (adjp ≤ 0.01), orange [adjp ≤ 0.01 and FC = 2] and blue (adjp ≤ 0.01 and FC ≥ 4) represents gene expression to drought stress.