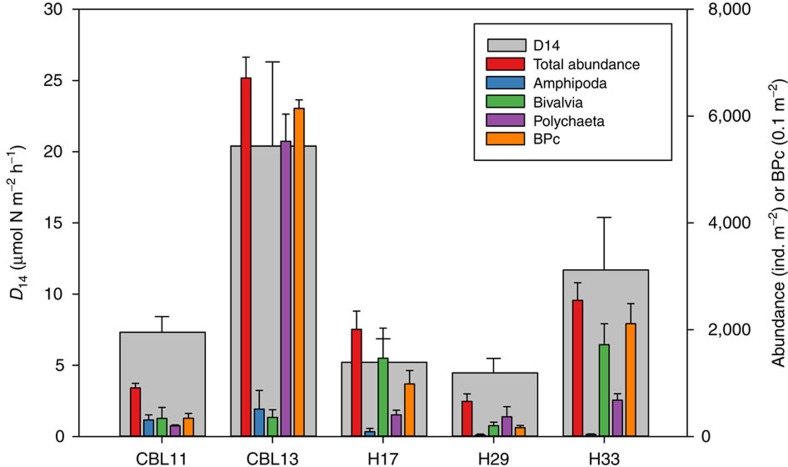
Figure 3. Station denitrification rates overlain by infauna abundance and bioturbation potential.
Mean (±s.e.m.) abundance and index of potential bioturbation (BPc) compared with denitrification (D14) rate at each station. Total infaunal abundance and BPc were calculated from all taxa collected at each station.

