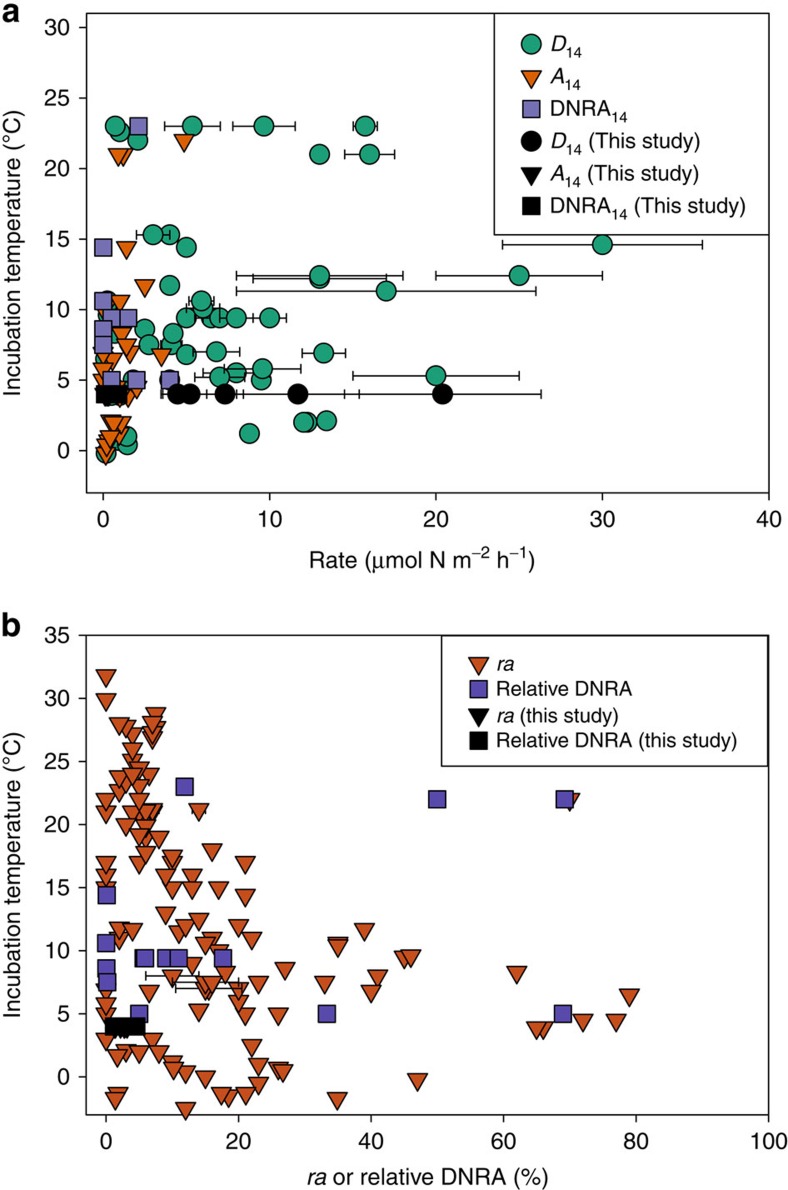
Figure 4. Survey of nitrogen transformation rates and ratios from literature and this study plotted by temperature.
(a) Rates of denitrification (D14, circles), anammox (A14, triangles) and DNRA14 (squares), and (b) the proportion of anammox compared with total N2 flux (ra) (triangles) or proportion of NO3− that underwent DNRA14 compared with denitrification (squares) plotted by temperature. Rates from this study (black symbols) were compared with surveyed literature. References and values are listed in Supplementary Table 2. All values were determined using the isotope pairing technique37,60. Rates and proportions are mean values and error bars are s.d., if provided.

