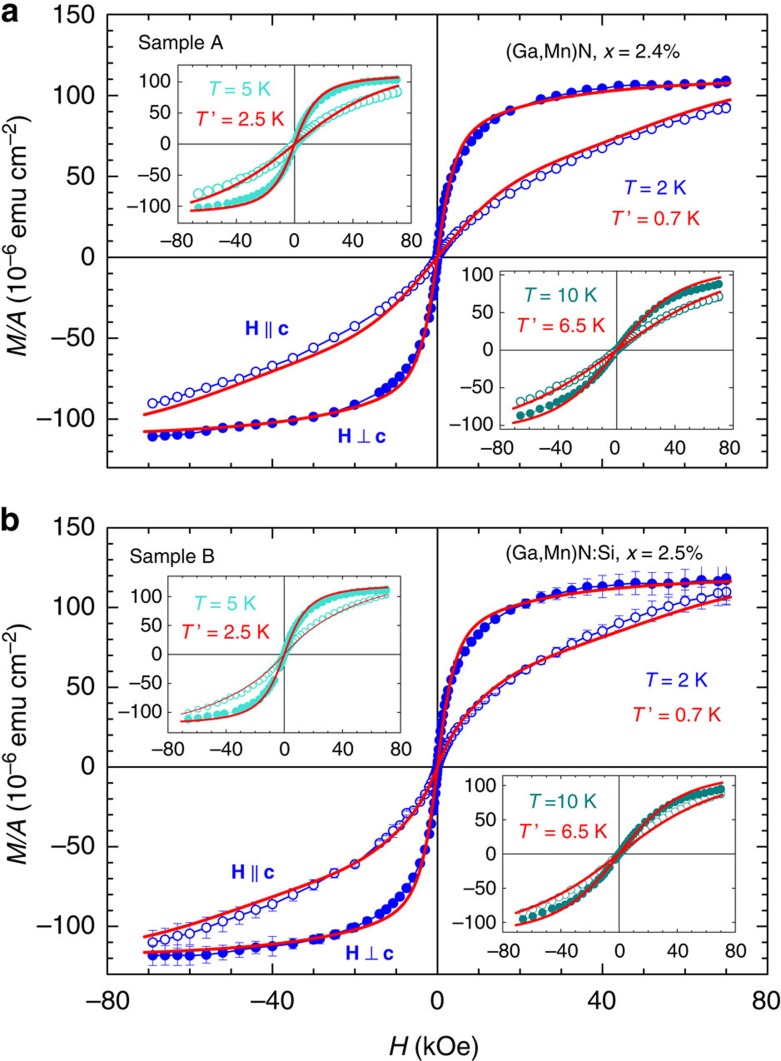
Figure 1. Areal density of magnetic moment.
(a) Ga1−xMnxN (sample A) and (b) Ga1−xMnxN:Si (sample B). Results are shown for selected temperatures T as a function of the magnetic field H applied parallel (open squares) and perpendicular (closed circles) to the wurtzite c axis. For clarity, experimental error bars are provided only for measurements at 2 K for sample B. Solid lines: magnetization curves calculated for Mn3+ ions (sample A) and for Mn3+ and Mn2+ ions in the case of sample B. T′ are the values of effective temperatures adjusted to account for ferromagnetic Mn3+−Mn3+ interactions.

