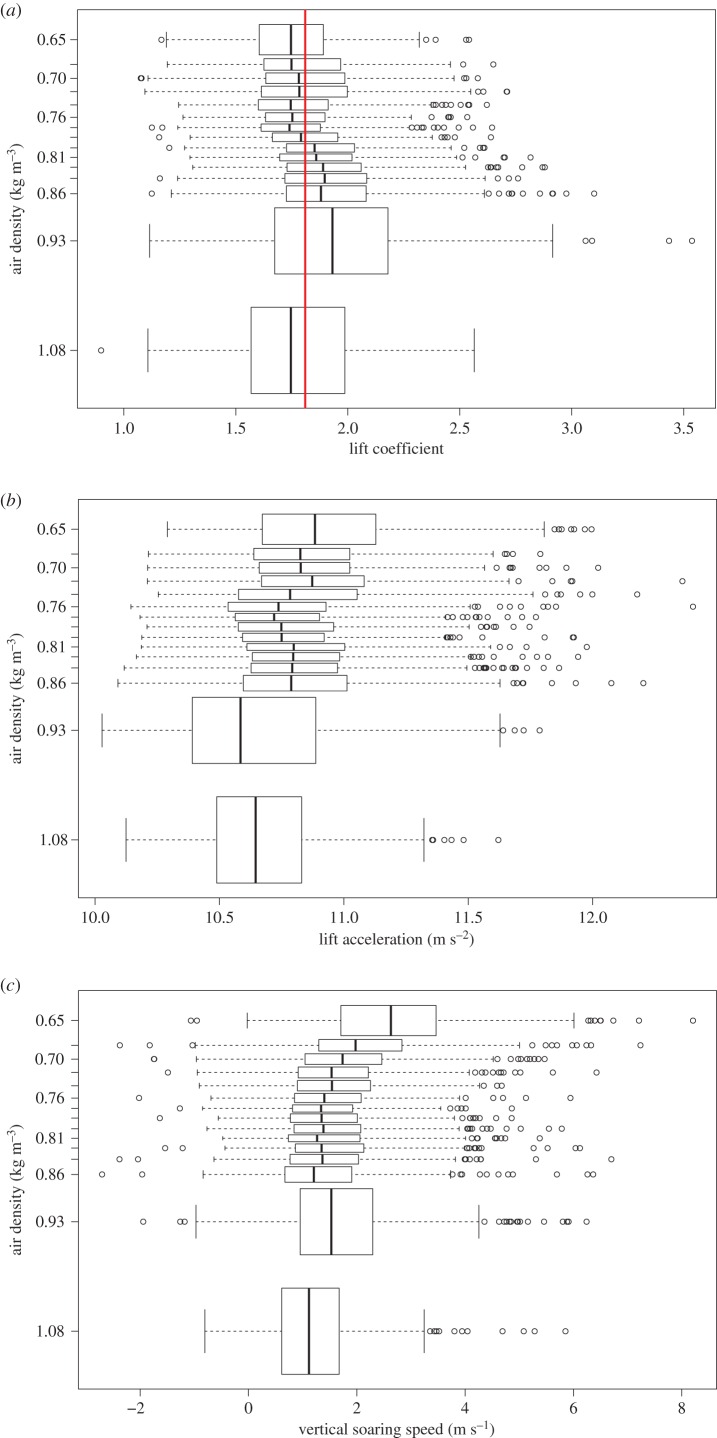
Figure 1.
Characteristics of acceleration at increasing elevations. (a) The vultures show small variations (−4% to +7%) in the lift coefficient over the entire flight elevation (air densities) range (red line marks the overall mean); (b) the lift acceleration varied very little with height (less than 2%); (c) the vertical soaring speed remained near constant, and even increased above 4500 m (air density less than 0.7 kg m−3). Boxes show mean (vertical line), quartile (box) and 95% (whiskers) confidence interval, as well as outliers (circles) in 15 elevation bins with equal observation numbers.

