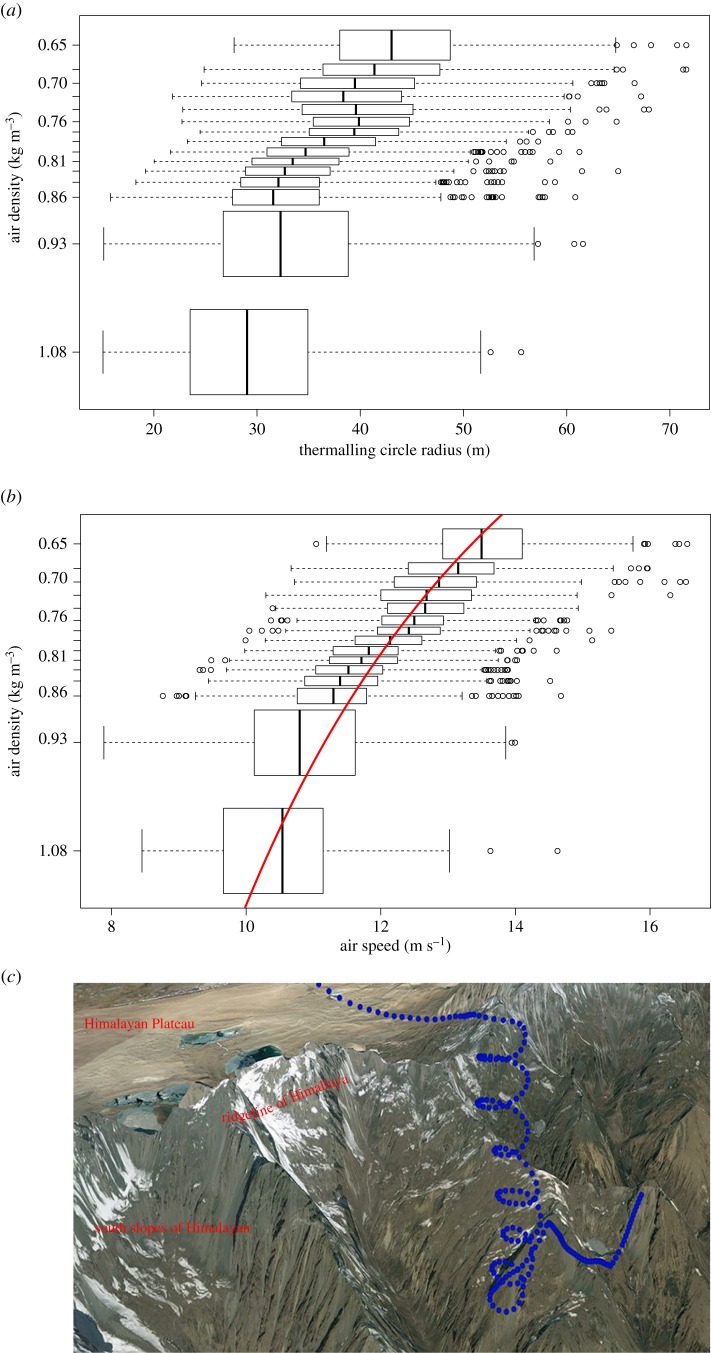
Figure 2.
Behavioural changes in the flight characteristics of thermalling vultures. (a) Flight circle radius increases in relation to decreasing air density (increasing elevation). (b) Airspeed increases with elevation. Red line represents a linear model fitted to the inverse of the air density and the squared airspeed (slope = 115.7, R2 = 0.46, p < 0.0001). Data show average (vertical line), quartile (box) and 95% CI, as well as outliers (circles) in 15 elevation bins. (c) One flight segment of the vulture Yoezer. Dots mark the reported GPS locations of the vulture during flight over the Himalaya ridge. Land surface and topography obtained from GoogleEarth.

