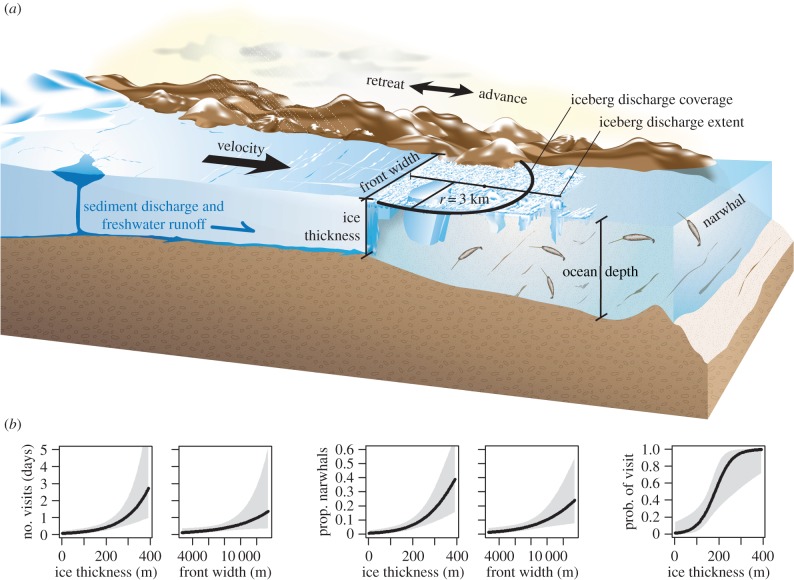
Figure 2.
(a) Glacier schematic with covariate labels, adapted from [23], (b) modelled relationships (and 95% CI) among covariates from top models in the 2000s at 7 km, explaining the number of visits, proportion of narwhals and probability of visits by narwhals at glaciers.

