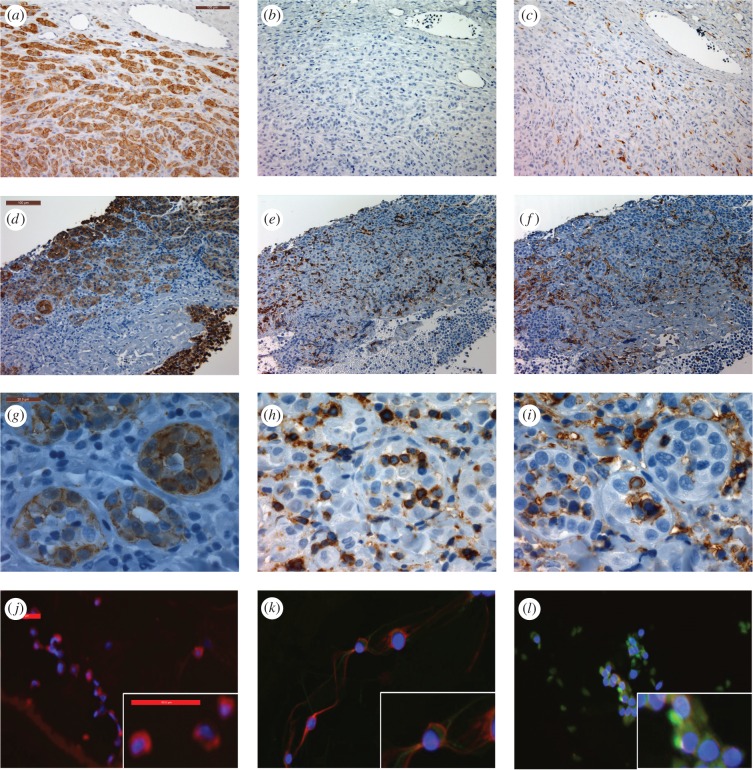
Figure 2.
Evidence for immune cell infiltration of DFT1 or MHC-I expression of DFT1 cells. (a–i) IHC staining of DFT1 tumour biopsies. Top and middle rows taken at 20× magnification, scale bar indicates 100 µm. Bottom row taken at 100× magnification, scale bar indicates 20 µm. Positive cells for each marker are brown; haematoxylin (blue) is the counter stain. (a,d,g) periaxin, marker for DFT1 cells; (b,e,h) CD3, marker for T lymphocytes; (c,f,i) MHC-II, marker for antigen-presenting cells; (a–c) typical DFT1 biopsy with no evidence of immune response; (d–f) tumour biopsy from TD5 showing infiltration of CD3 and MHC-II positive cells throughout the tumour; (g–i) tumour biopsy from TD5 showing immune cells infiltrating DFT1 cell clusters. (j–l) ICC of DFT1 cells with periaxin (red), and β2m (green) to identify MHC-I surface expression: (j) DFT1 cells from culture; (k) DFT1 FNA from TD6 collected in November 2013; (l) DFT1 FNA from TD6 collected in February 2014. (ICC images taken at 20× magnification, each scale bar indicates 50 µm.)

