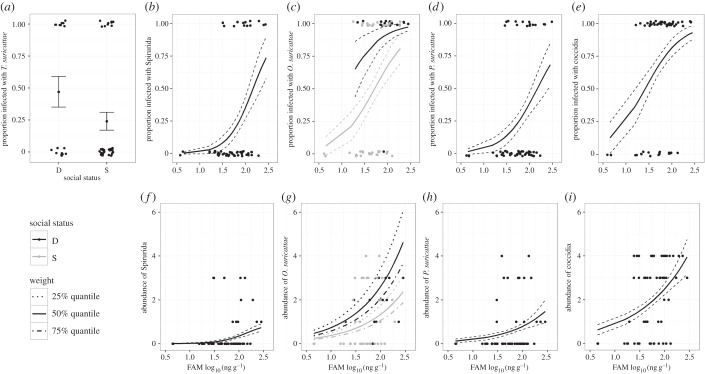
Figure 2.
Predictors that significantly explained variance in parasitism in female meerkats (see electronic supplementary material, tables S1 and S2). Shown are the predicted fits for binomial GLMs (for infection status, a–e) and Poisson GLMs (for abundance, f–i). Error bars or hashed lines indicate s.e. estimates (a–i). For both values reflecting parasitism by Oxynema suricattae (c and g), separate predicted fits are shown for dominant (black) and subordinate (grey) females. For abundance of O. suricattae (g), predicted fits are plotted for the 25th quantile (540.75 g; dotted lines), 50th quantile (653.50 g; solid lines) and 75th quantile (750 g; hashed-dotted lines) of weight.

