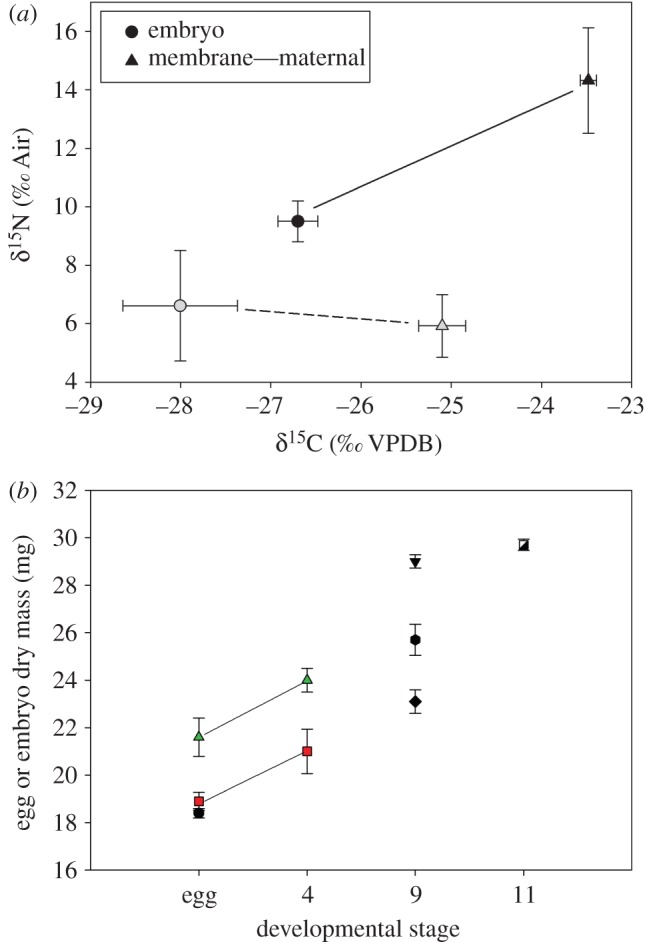
Figure 2.

(a) Mean (±s.e.) δ15N and δ13C stable isotope values for the maternal membrane (triangles) and embryos (circles) of control (grey symbols) and labelled (black symbols) brooding marsupial frogs fed insects for six weeks; lines connect treatments. (b) Mean dry mass of embryos (±s.e.) increased with developmental stage. Each type of symbol represents embryos from an individual female (n = 7); each line connects unfertilized eggs and embryos from the same female. (Online version in colour.)
