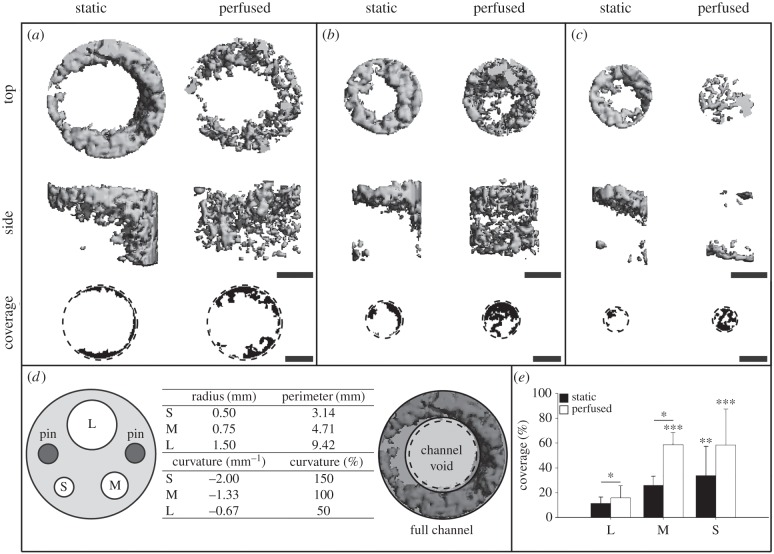
Figure 1.
Three-dimensional images of mineralized tissue formed in the full channel with the corresponding coverage in the channel void for (a) L channels, (b) M channels and (c) S channels. (d) Schematic illustration of the scaffold geometry with the three different channel sizes and the two pin holes (left). Radii, perimeters, curvatures and relative curvatures of all channels (middle). Schematic representation of the two volumes (full channel and channel void) used for the evaluation of mineralized tissue formation in the channel (right). (e) Coverage of channel void. Scale bar, 1 mm. *p ≤ 0.05. **p ≤ 0.05. ***p ≤ 0.01. ** and *** indicate statistical significances between different curvatures within the same bioreactor type.

