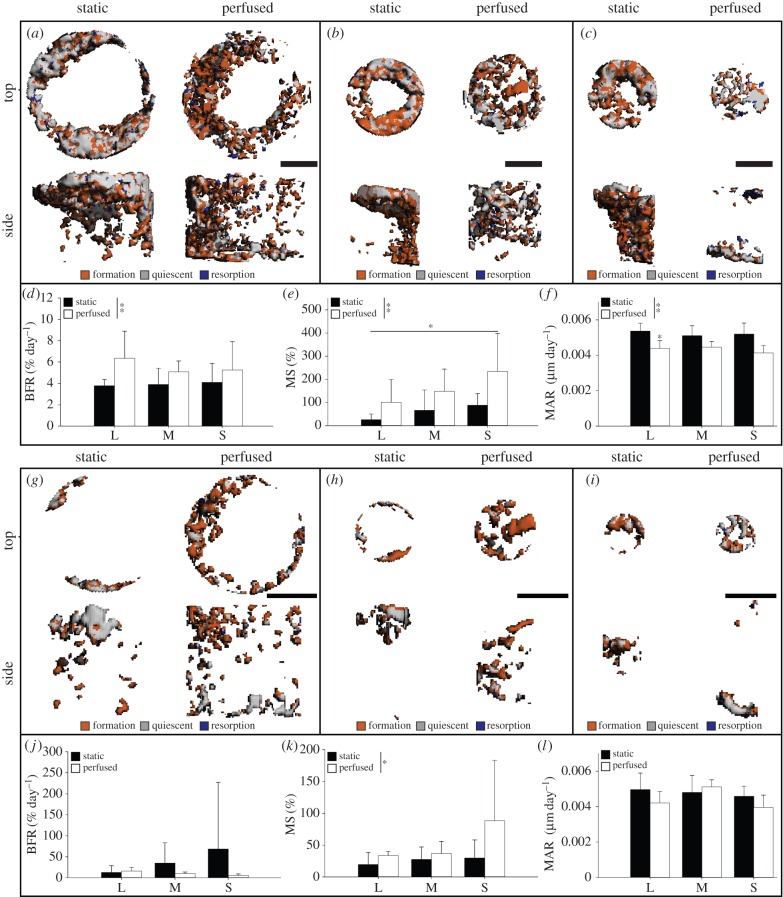
Figure 3.
Three-dimensional images of registered scans of time point 2 and time point 4 showing newly formed (orange), quiescent (grey) and resorbed (blue) mineralized tissue for L channels (a,g), M channels (b,h), and S channels (c,i) in the full channel and the channel void, respectively. Dynamic mineralized tissue morphometric parameters for the full channel and the channel void are depicted as (d,j) mineralized tissue formation rate (BFR), (e,k) mineralizing surface (MS) and (f,l) mineral apposition rate (MAR). Scale bar, 1 mm. *p ≤ 0.05. **p ≤ 0.01. (Online version in colour.)

