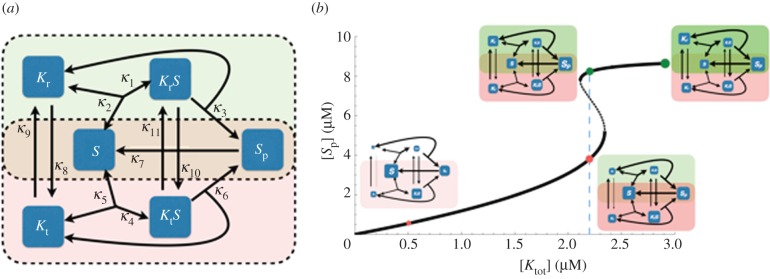
Figure 2.
Schematic of the core signalling motif displaying bistability. (a) Cartoon representation of the two interconnected reaction cycles constituting the core bistable system. The arrows represent reactions in the system and are labelled with the kinetic parameters from equation (4.2). Two rectangles (dashed line) with different background colour show the two futile cycles with Kr (green) and Kt (red) competing for the substrate (in the intersected region of the two rectangles). (b) Bifurcation plot of core bistable signalling motif. The solid line corresponds to the stable steady-state levels of [Sp] with increasing signal given by the total concentration of kinase [Ktot]. The dashed line corresponds to the unstable steady states. The parameter values used to generate the bifurcation plot are listed in the electronic supplementary material, table S3. The four little cartoons, drawn as inset, are showing the allocation of all species' concentrations and corresponding reaction fluxes at the different levels of [Ktot], as indicated by the coloured dots. For each cartoon, the size of the species' boxes and reaction arrows are calculated from the actual species' concentrations and the levels of the reaction fluxes, namely κ1[KrS], κ2[KrS], κ3[KrS], κ4[KtS], κ5[KtS], κ6[KtS], κ7[Sp], κ8[Kr], κ9[Kt], κ10[KrS] and κ11[KtS]. Specifically, the species' concentrations and reaction flux values are mapped on the cartoon by log-transforming the actual value and then mapping these onto a specific interval; the intervals used for arrow thickness and box size were [0.5,13] and [20,100], respectively. The transparency index for the two overlay boxes indicating two futile cycles mediated by Kr (green) and Kt (red) are calculated by log-transforming the total concentrations of Kr and Kt containing species and mapping these onto an interval [0,100].

