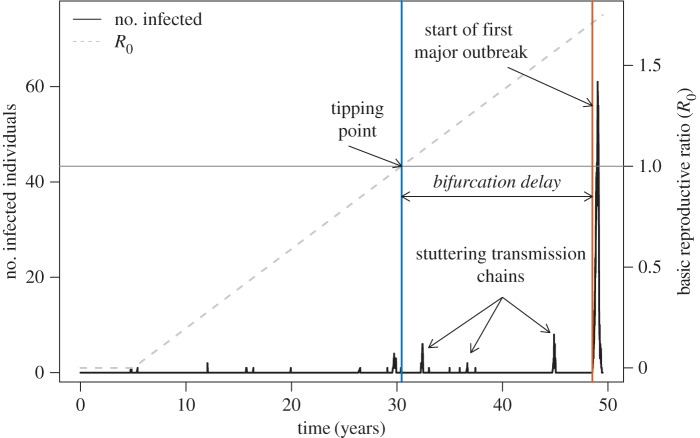
Figure 1.
Bifurcation delay is the time between the tipping point at R0 = 1 (intersection of grey horizontal line and blue vertical line) and the beginning of an actual disease epidemic (orange vertical line, definition in text). This simulated time series is a stochastic realization of the hinge SIR model, where the transmission rate (β) begins to increase at a set time (here, t = 5 years) at rate α. This example contains multiple ‘sparks’ after the transition to supercriticality that do not lead to epidemics, demonstrating that bifurcation delay is not simply the waiting time for a spark to occur after R0 > 1. Other parameters for this simulation: rate of increase in transmission, α = 0.001 yr−1, initial population size (N0) = 1000, recovery rate, γ = 365/14 yr−1 (corresponding to a 14 day infectious period), spontaneous infection rate, ξ = 0.00067 yr−1, birth and death rate, μ = 1/60 yr−1. (Online version in colour.)

