
Figure 4.
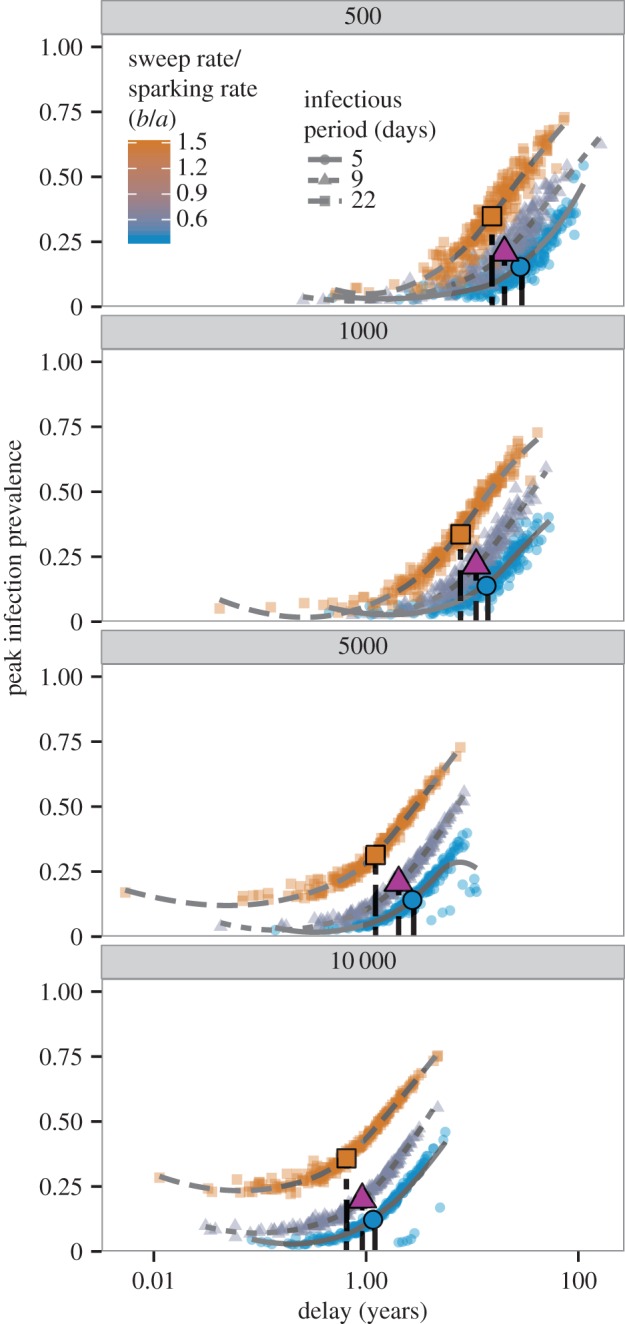
Bifurcation delay can lead to epidemics with greater peak prevalence, although this effect depends on the life-history parameters of the system. Panels show peak epidemic prevalence by stochastic realizations of bifurcation delay (x-axis on log-scale). Symbols and line types represent three different infectious periods, approximating three important childhood diseases (5 days for measles, 9 days for chickenpox, 22 days for pertussis). Lines are loess smooths added for visual clarity. Colour represents the ratio of b to a, which describes how quickly R0 changes relative to how frequently imported infections occur in a system. Symbols are positioned at the median of the x- and y-axes for each combination of life-history parameters. Panels show four different initial population sizes (N0 = 500, 1000, 5000 and 10 000). The relationship between delay and peak infection prevalence depends on how quickly R0 increases, which is governed by the sweep rate, mean infectious period and population size. (Online version in colour.)