Figure 1.

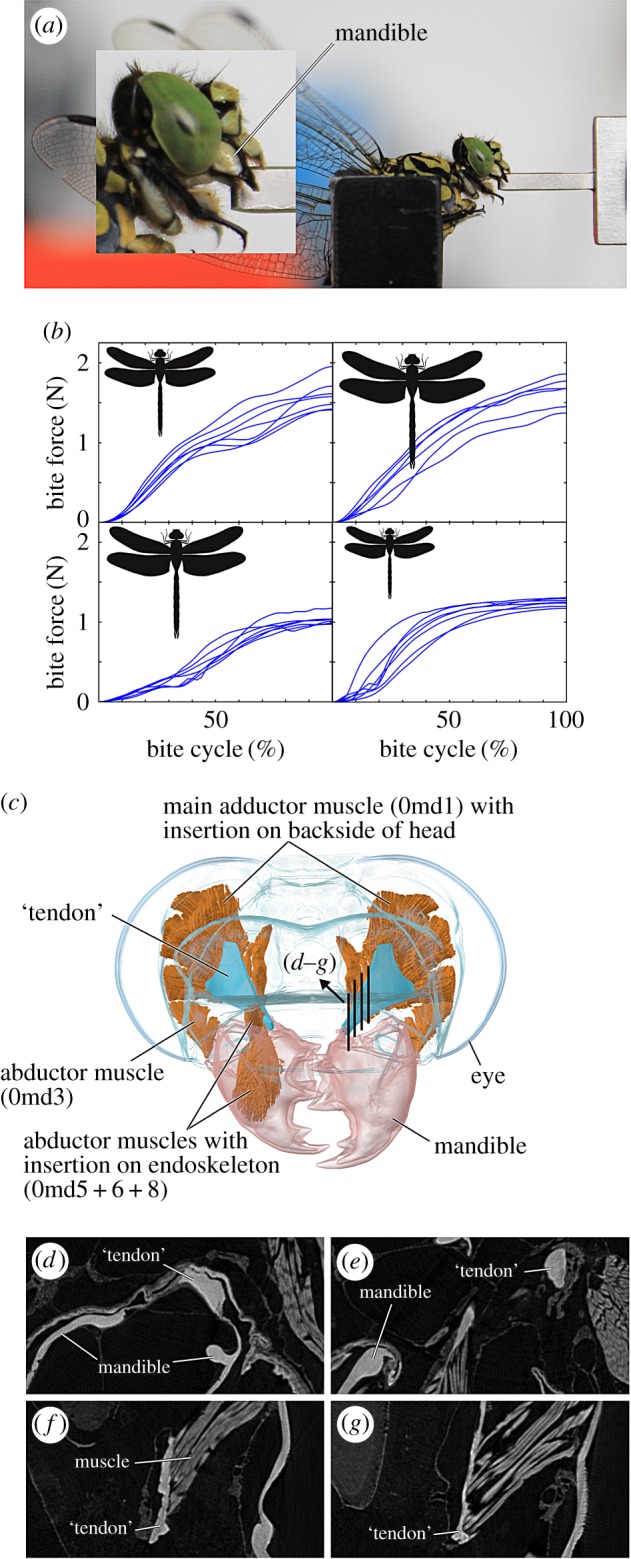
Experimental set-up and bite force time series. (a) Lateral view of the dragonfly Onychogomphus forcipatus biting onto the piezoelectric force sensor. (b) Bite time series showing the progression of bite force until the peak bite force is reached. From left to right: Aeshna mixta, Anax imperator, Cordulegaster bidentata, Onychogmphus forcipatus. Line drawing representations of dragonflies are in proportion to each other. Note the comparably high bite force of O. forcipatus compared with its body size. (c) Three-dimensional model of the head of O. forcipatus in frontal view showing the mandibular muscle configuration. Abbreviations: 0md1, M. craniomandibularis internus; 0md3, M. craniomandibularis externus posterior; 0md5, M. tentoriomandibularis lateralis superior; 0md6, M. tentoriomandibularis lateralis inferior; 0md8, M. tentoriomandibularis medialis inferior. (d–g) Sagittal cross sections through the tendon–muscle connection to show the similarity in grey values between the ‘tendon’ and the mandible. Refer to (c) for the location of the cross sections. The same grey values relate to the same material density, which can relate to material properties.
