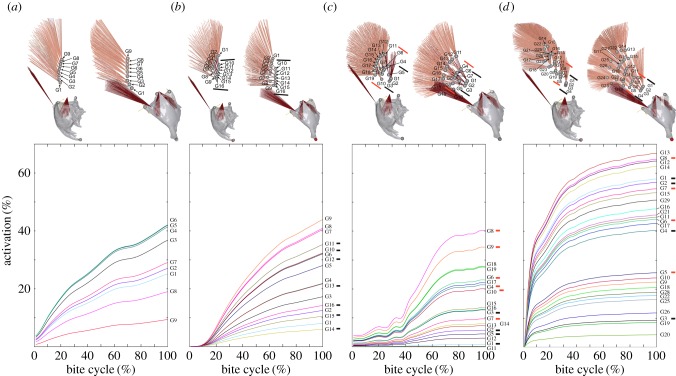
Figure 3.
Spatial muscle activation for the main mandibular adductor. Mean activation for each muscle subgroup is shown for the strongest bite measured in each species. (a) Aeshna/Sympetrum, (b) Anax imperator, (c) Cordulegaster bidentata, (d) Onychogomphus forcipatus. The upper row shows both frontal and lateral views of the muscle groups to faciliate correlation with the graphs, where muscle groups are indicated on the right side, respectively. Black and orange lines in the three-dimensional models correspond to black and orange lines used to highlight medial muscle subgroups in the graphs. For a full overview of activation patterns for several bites and each muscle group within M. craniomandibularis internus please refer to the electronic supplementary material, figure S2. All models are normalized for size.

