Figure 2.
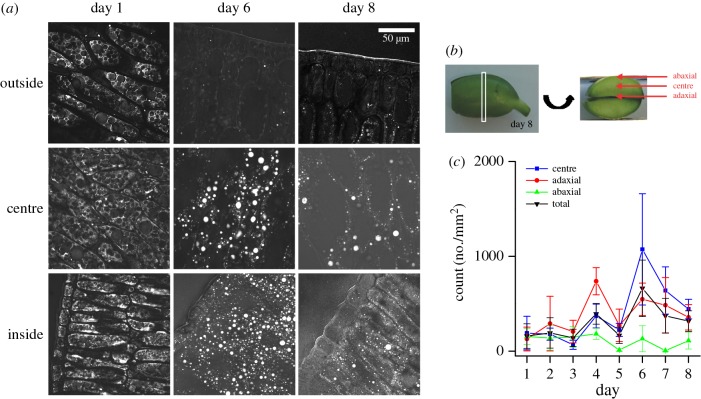
(a) Representative CARS images obtained using the CH2 symmetric stretch vibration (2845 cm−1) of lipids as contrast, at days 1, 6 and 8 of soya bean cotyledons post imbibition. Samples were imaged after fixation and cryo-slicing (15 µm thickness). Images show location-dependent oil body size changes and the disappearance of lipids from the abaxial region of the cotyledon. (b) Schematic showing the regions of the soya bean cotyledon for image acquisition. All images were taken 3–5 mm from the embryo. (c) Quantification of oil body density for large oil bodies: diameter more than 3 µm, using the RATS thresholding on maximum intensity projected images from six image sub-stacks as described in the Material and methods. Quantification of large oil bodies showed the appearance of larger entities at day 4 and day 6, for the adaxial and centre, respectively. Errors bars are standard deviation from quantification in three separate sections.

