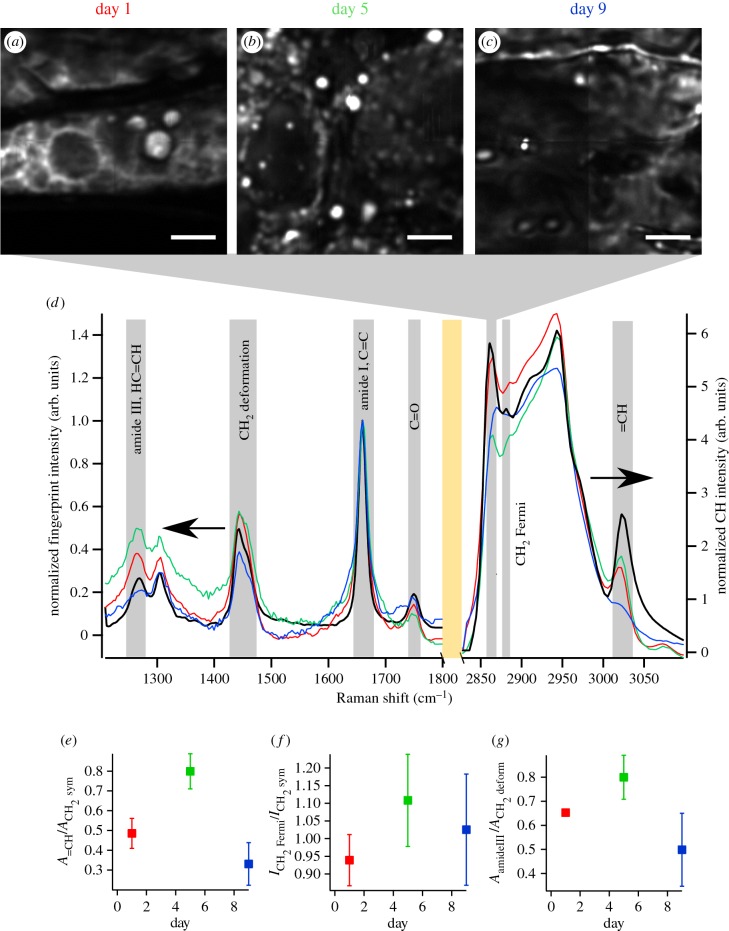
Figure 3.
Plots of the CH2 symmetric stretch intensities (integrated over 2845–2852 cm−1 of RL spectra) from hyperspectral CARS microscopy datasets of soya bean cotyledon sections at (a) day 1, (b) day 5 and (c) day 9 post imbibition. (d) Average, normalized RL spectra from at least four different CH2-rich ROIs in the respective images show the local composition of oil bodies with same colour scheme as in (a). The spectrum of refined soya bean oil is shown in black. Grey rectangles show specific vibrational bands, and the orange rectangle marks the division between the fingerprint to CH regions of the graph. (e) Lipid unsaturation, as indicated by  where A is the peak area determined from multi-peak fitting, increased from day 1 to day 5, and dropped below the starting value at day 9. (f) Lipid chain order
  , where
  and
and  are the RL spectral intensities from 2885 and 2848 cm−1, respectively, increased from approximately 0.94 at day 1 to 1.13 at day 5 before decreasing again to 1.02 by day 9. (g) Protein content, as assessed by
  dropped at day 9 following an increase at day 5 when compared with day 1. Error bars in (e–g) are standard deviation calculated from N > 4 spectra from ROIs within each sample. ROIs always consisted of at least 10 voxels (spectra) for averaging. Scale bar in (a–c) is 10 µm.

