Figure 4.
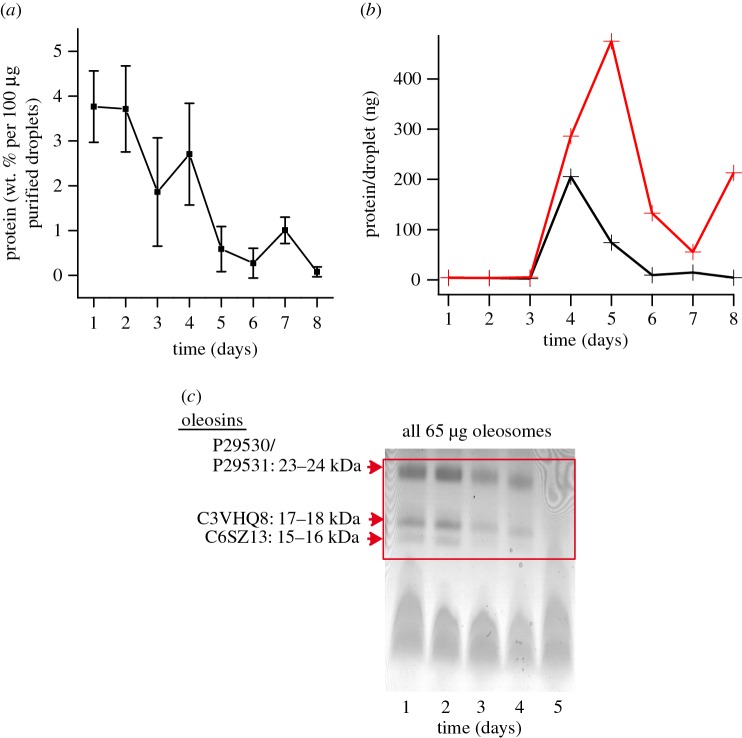
(a) Bradford assay to quantify weight % of total protein associated with oil bodies. All samples had the same dry weight of oil bodies. Error bars are standard deviation from the three independent oil body extractions. (b) Calculation of protein per oil body, based on the size of extracted oil bodies (electronic supplementary material, figure S4) and Bradford measurements with 100 µg of purified oil bodies. A constant density of oil (gm ml−1) was assumed for the oil bodies at each day. The red line shows the calculated protein per oil body by keeping weight % of protein constant at the Bradford measurement from day 1 and varying only the number of oil bodies according to the change in size (electronic supplementary material, figure S4). The black line is the measured protein per oil body calculated using the actual Bradford measurement at each day along with the change in oil body size. The difference between the black and red lines indicates that the amount of protein associated with oil bodies was actively changed during germination. (c) SDS–PAGE showing reduction of oleosins during germination. Oleosins are no longer visible after day 5 via Coomassie staining.

