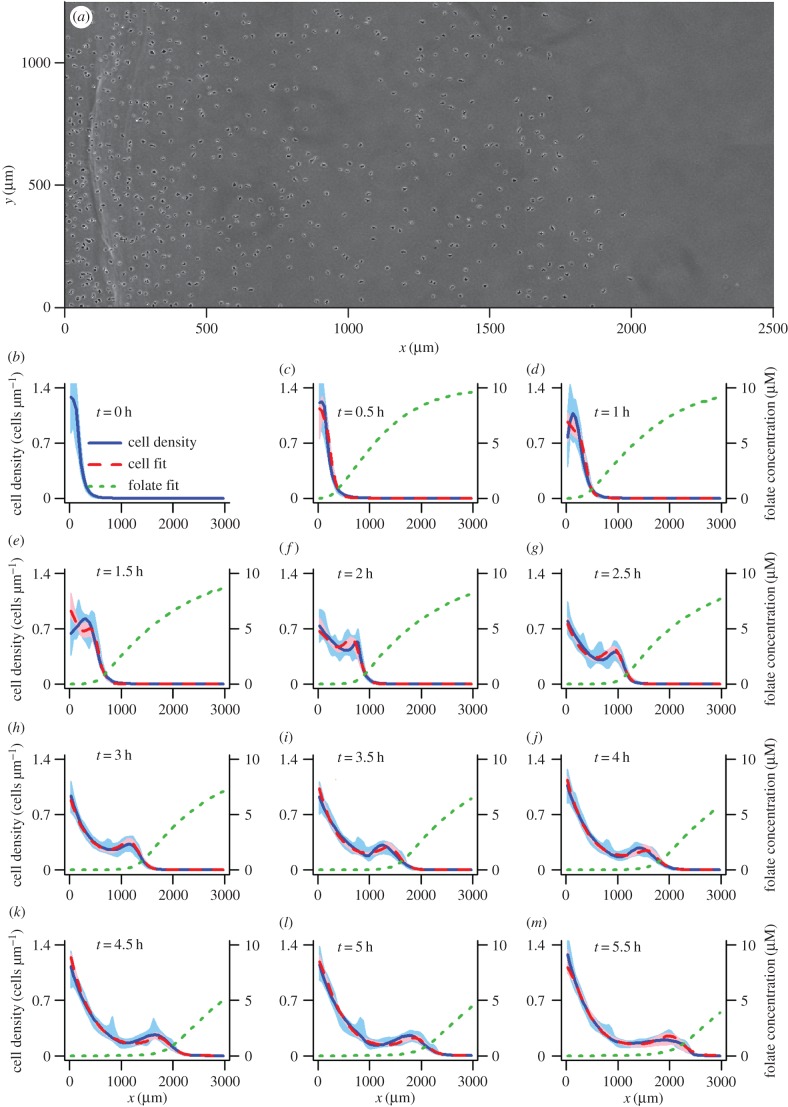
Figure 1.
(a) Image taken 4 h into the Dictyostelium discoideum cell movement assay (see (j) for corresponding cell density estimate). (b–m) Cell distributions obtained every half hour using logspline density estimation [21–23] in the x-dimension are shown by blue lines, with 95 percentile intervals obtained using 10 000 bootstrap samples of the data indicated by blue shaded areas. Cell distributions produced by the best model (the receptor saturation model, table 1) for this dataset, using the optimized parameters from the bootstrap optimization that gave the highest value of the maximum weighted log-likelihood (equation (4.4)), are shown by dashed red lines. The corresponding folate distributions predicted by this model are indicated by green dotted lines. Pink shaded areas show the 95 percentile interval for the modelled cell density, based on 200 samples from the pseudo-posterior.

