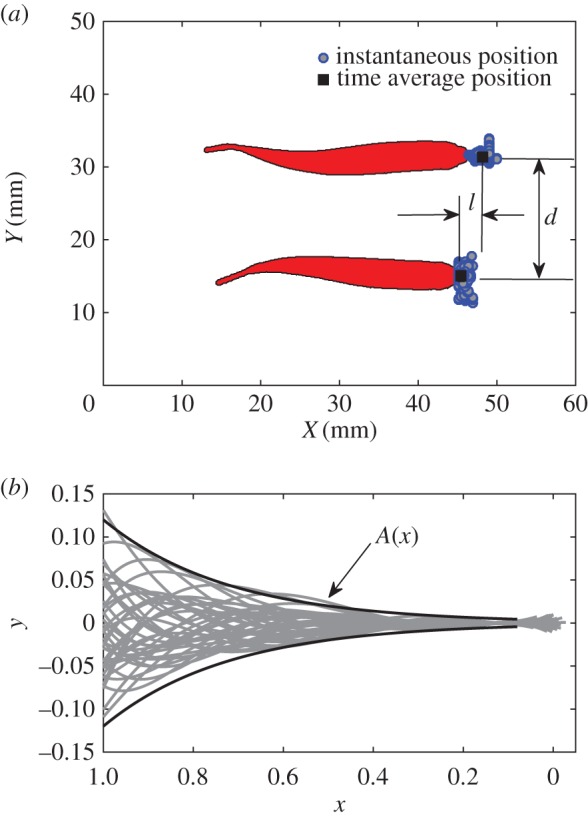
Figure 1.

(a) Example of top visualization of two swimming fish. The school pattern is defined by the two characteristic length scales d and l, representing the distance to the nearest neighbour(s) and the shift between leading and following individuals, respectively. (b) Superimposed instantaneous swimming kinematics (middle lines) extracted from the visualization. The black lines are the spatial envelop fitted with the analytical function A(x) = Ar exp α(x − 1) [10]. The head of the fish is located on the right, the tip of the caudal fin on the left.
