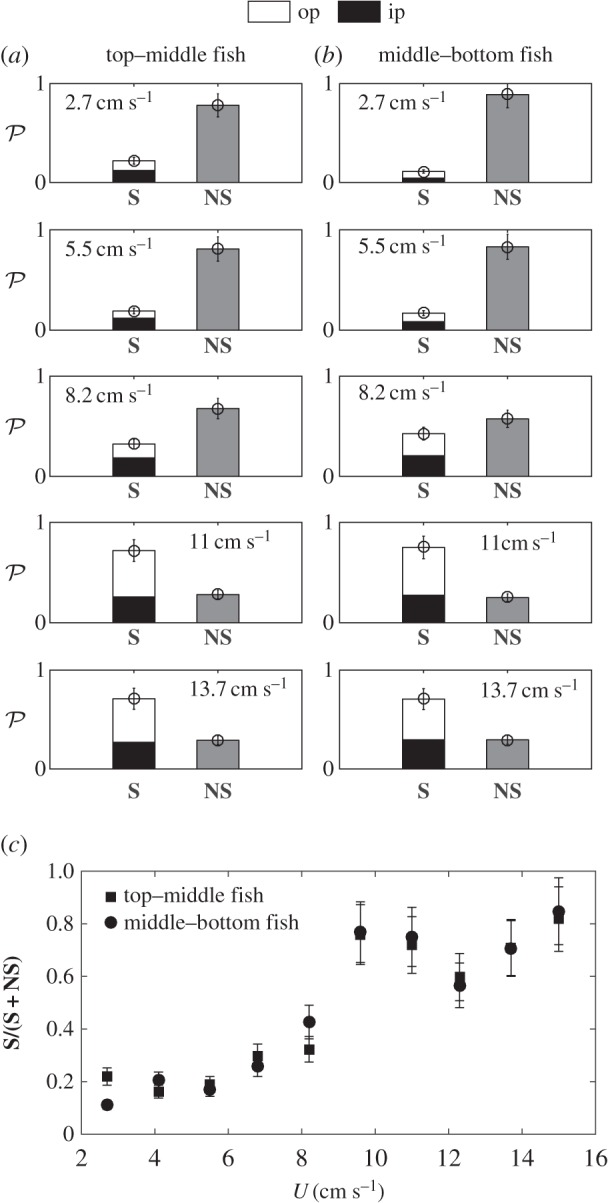
Figure 8.

(a,b) Cumulated probability histograms of synchronization over seven different fish trios at different flow velocities. In each frame, the left bar represents the percentage of time where the fish were synchronized (S), in phase (black fill) or out of phase (white fill), over a 10 s recording of the swimming kinematics. The right bar is the time spent out of synchronization (NS). (c) Plot showing the cumulative probability of a synchronized state between top and middle fish (squares) and middle and bottom fish (circles), as a function of swimming speed.
