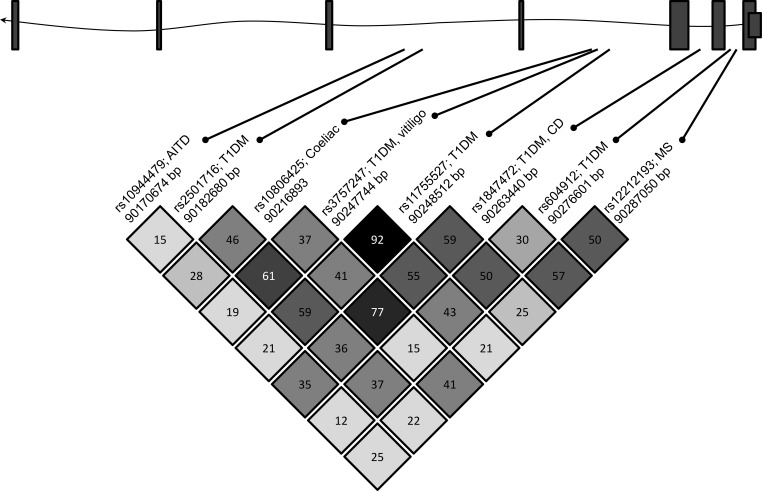
Figure 1.
Schematic representation of the BACH2 locus and pairwise LD r2 measures between selected BACH2 SNPs previously associated with autoimmune conditions. At the top of the figure, a diagrammatic representation of the BACH2 gene is shown. Exons are denoted by boxes, and intronic sequence by the line. In the lower half of the figure, SNPs previously associated with autoimmune conditions are identified by their unique rs numbers. The autoimmune diseases associated with each SNP are shown (AITD, autoimmune thyroid disease; T1DM, type 1 diabetes; MS, multiple sclerosis; CD, Crohn's disease), as is the base pair position of each SNP. Arrows mark the approximate location of each SNP relative to the introns and exons.

