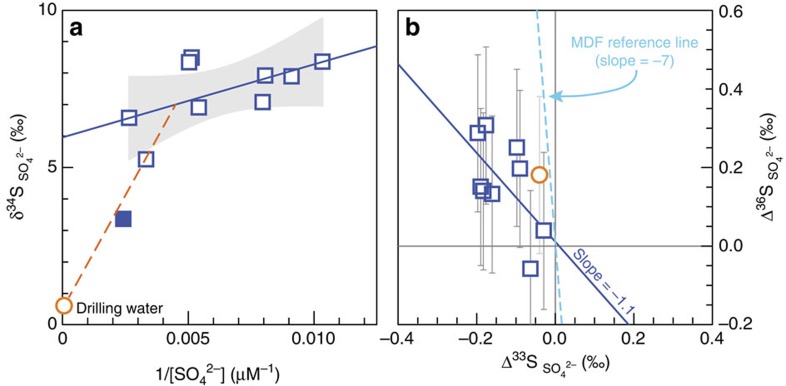
Figure 2. Concentrations and sulfur isotope compositions of dissolved sulfate (open blue squares) in the Kidd Creek fracture waters.
Error bars (if not shown, smaller than the symbols) are 1σ uncertainty. The data for drilling water (open orange circle) are also plotted in each panel for reference. (a) Dissolved sulfate data show a linear trend (solid line). Drilling water sulfate sits far below the linear trend and the 95% confidence interval (shaded area), indicating negligible drilling water contribution to the fracture water samples. The exception is one sample (solid square) that was collected immediately after drilling and hence still shows the effect of mixing with drilling water (also see note ‡ for this sample in Table 1). (b) Dissolved sulfate data have a diagnostic MIF Δ36S/Δ33S slope of −1.1 (solid line), consistent with Archaean sulfur containing minerals, and distinctly different from the classic MDF slope of −7 (dashed line). Note: the sample mixed with drilling water was not included in b.

