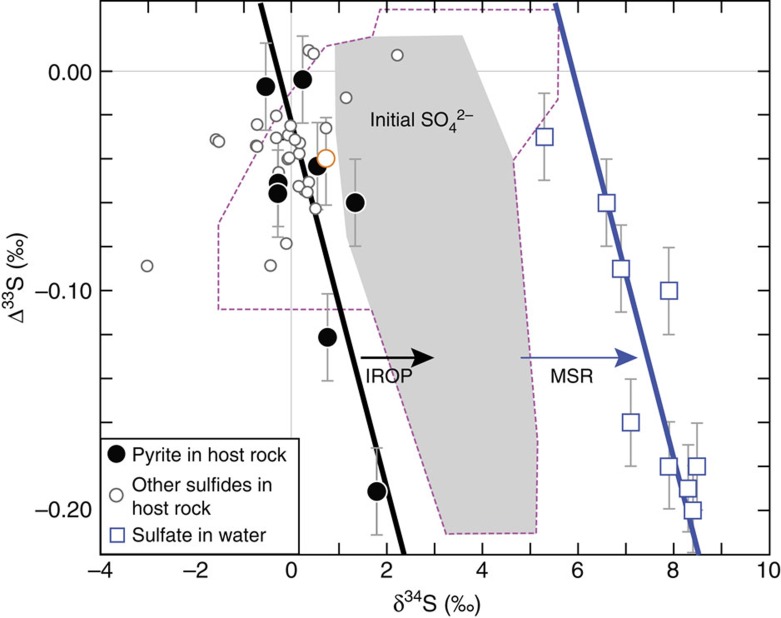
Figure 3. Comparison of δ34S and Δ33S between dissolved sulfate and host-rock sulfides.
Error bars (if not shown, smaller than the symbols) are 1σ uncertainty. Dissolved sulfate in drilling water (open orange circle) is also plotted for comparison. The black solid line represents mixing between pyrite minerals with different sulfur isotope compositions15 and the blue solid line represents mixing between dissolved sulfate in the fracture waters, respectively. Based on the estimated 1.5‰ to 3.4‰ enrichment36 in δ34S in the product sulfate during the indirect radiolytic oxidation of pyrite (IROP), the initial isotopic compositions of product sulfate are shown as the area in grey (for pyrite only), or the area defined by the dashed magenta lines (for all sulfides). Significantly, δ34S values for dissolved sulfate in the fracture water are instead ∼6‰ more enriched in 34S than pyrite, suggesting that an additional process of isotopic enrichment, possibly microbial sulfate reduction (MSR), has affected the measured sulfate (see text).

