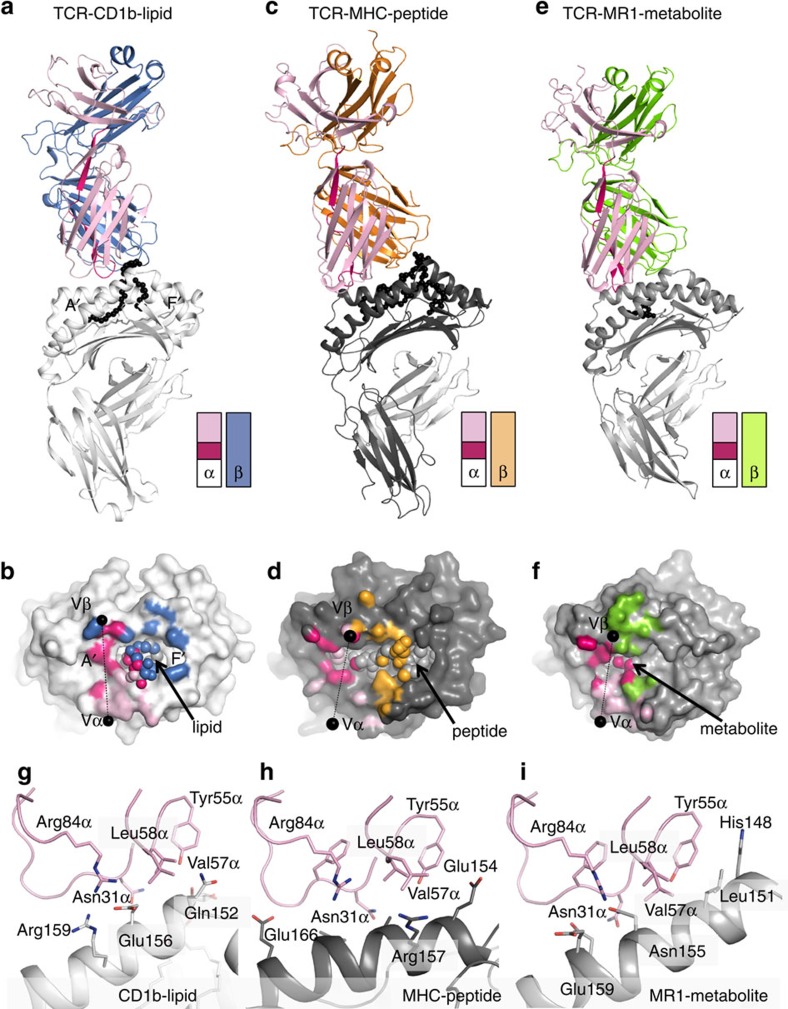
Figure 1. TRAV1-2 TCRs recognize CD1b, MHC-I and MR1.
Overview of the TRAV1-2 TCRs in complex with CD1b (coloured white; a,b,g), MHC-I (coloured dark grey; c,d,h) and MR1 (coloured light grey; e,f,i) molecules. The top panels show the overview of each complex represented in cartoon format with the antigen in black spheres. The TRAV1-2 gene segment is coloured in light pink, the TRAJ gene segment in vibrant pink, and the β-chain in blue, orange and green for GEM42 TCR (a,b), ELS4 TCR (c,d) and MAIT TCR (e,f), respectively. A schematic of each TCR gene segment is represented as two rectangles for the α and β-chains, with TRAV1-2, TRAJ and the β-chains coloured as per the top panels. The middle panels show the footprint of each TCR on the surface of the CD1b-lipid (b), MHC-peptide (d) and MR1-metabolite (f). The black spheres on the middle panels represent the centre of mass of the Vα and Vβ domains, while the light grey spheres represent the antigen bound in each molecule. The atomic footprint is coloured according to the TCR segment making contact. The bottom panels show the TRAV1-2 gene segment (light pink) contact with (g) CD1b-lipid (white), (h) MHC-peptide (dark grey) and (i) MR1 (light grey).

