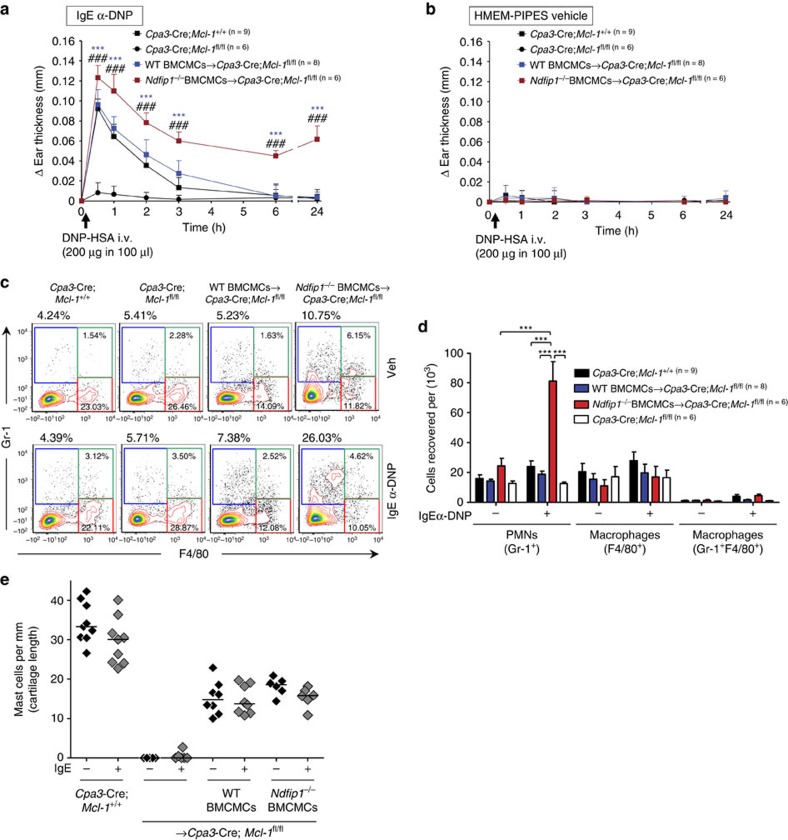
Figure 7. Mast cell–Ndfip1 restrains IgE-mediated passive cutaneous anaphylaxis.
Changes (Δ) in ear thickness 0–24 h after i.v. injection of DNP–HSA (200 μg in 100 μl) into mice, with DNP–HSA given 16 h after i.d. injection of (a) anti-DNP IgE (SPE-7, 100 ng) in the right ear pinna and (b) equal volume of HMEM-Pipes vehicle in the left ear pinna of (a,b) Cpa3-Cre; Mcl-1+/+ (filled black squares), mast cell-deficient Cpa3-Cre; Mcl-1fl/fl (filled black circles), and mast cell-deficient mice engrafted i.d. with WT BMCMCs (WT BMCMCs→Cpa3-Cre; Mcl-1fl/fl, filled blue squares) or Ndfip1−/− BMCMCs (Ndfip1−/− BMCMCs→Cpa3-Cre; Mcl-1fl/fl, filled red squares). (c) Representative flow cytometric plots; and (d) Cells recovered per ear of gated populations of polymorphonuclear (PMN) leukocytes (Gr-1+F4/80−) and macrophages (Gr-1−F4/80+ and Gr-1+F4/80+). Percentage values in c refer to percentage of CD45+ viable cells present in the depicted section of the plot. (e) Dermal mast cell numbers in ear pinnae of mice at the completion the PCA experiments (that is, at 24 h after injection of DNP–HSA) outlined in (a,b). (a,b,d) Data (mean±s.d.) are pooled from the two independent experiments performed, each of which gave similar results, each with 3–5 mice per group. (a,b) ***P<0.001 for comparisons of WT BMCMCs versus Ndfip1−/− BMCMCs→Cpa3-Cre; Mcl-1fl/fl mice. ###P<0.001 for comparisons of WT mice versus Ndfip1−/− MCs→Cpa3-Cre; Mcl-1fl/fl mice (two-way analysis of variance (ANOVA) with Bonferroni post test). (d) ***P<0.001 for indicated comparisons (one-way ANOVA with Bonferroni post test).

