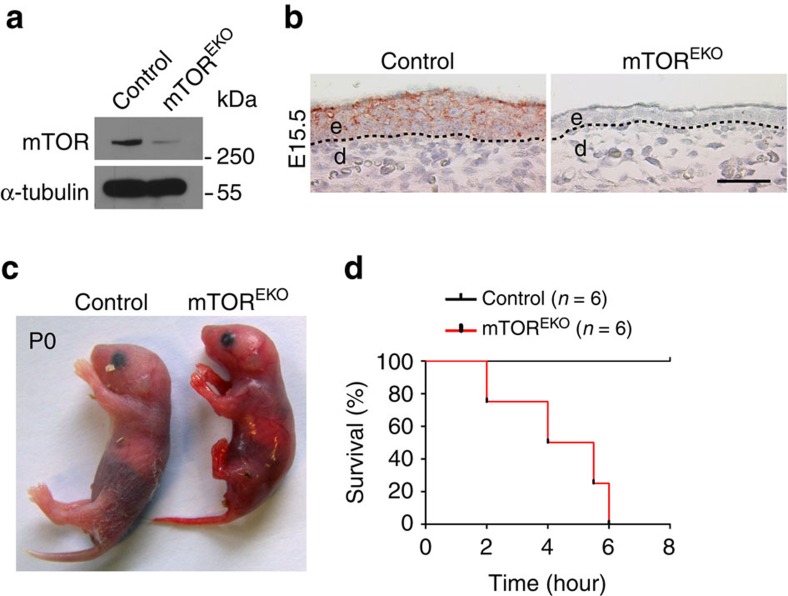
Figure 1. Conditional targeting of Mtor and perinatal lethality of mTOREKO mice.
(a) Western blot analysis for mTOR protein in epidermis isolated from control and mTOREKO embryos. (b) Representative mTOR-immunostaining of skin in embryos at E15.5; dashed line indicates basal membrane; scale bar 25 μm; (c) Macroscopic appearance of newborns. (d) Kaplan–Meier plot illustrating the survival rate of newborns.

