
Figure 1.
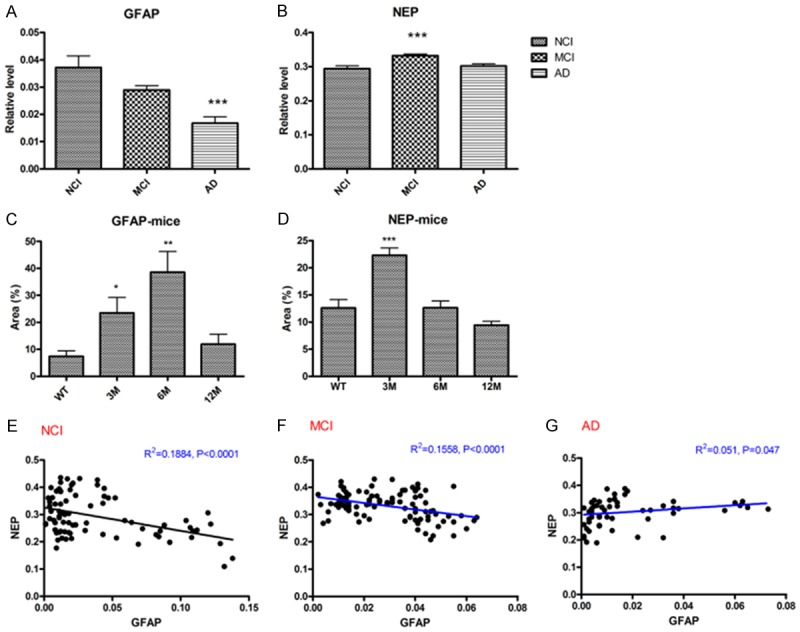
The relationship between NEP and GFAP in AD: (1) correlation analysis of NEP/GFAP pixel density. A significant negative correlation between NEP and GFAP was observed in both NCI (R2 = 0.1884, P < 0.0001) and MCI brains (R2 = 0.1558, P < 0.0001). However, positive correlation between NEP and GFAP was observed in AD brains (R2 = 0.051, P = 0.047). E: NCI; F: MCI; G: AD. (2) The relative levels of NEP and GFAP in NCI, MCI and AD cortex. Brain slides from NCI, MCI and AD cortex were immunostained for NEP and GFAP followed by quantitative analysis using Art Imaging Systems VectraTM. A: GFAP; B: NEP. The data are expressed as mean ± SEM. ***P < 0.01 vs NCI control. (3) Alteration of cortical NEP and GFAP levels in APP/PS1 transgenic mice. Brain slides from C57 WT mice and various ages of transgenic APP/PS1 were immunostained for NEP and GFAP following by quantitative analysis using Art Imaging Systems NuanceTM. Total positive pixel area for NEP and GFAP in mice at 3, 6, 9 and 12 months of age. C: GFAP; D: NEP. The data are expressed as mean ± SEM. *P < 0.05, **P < 0.01 vs WT control.