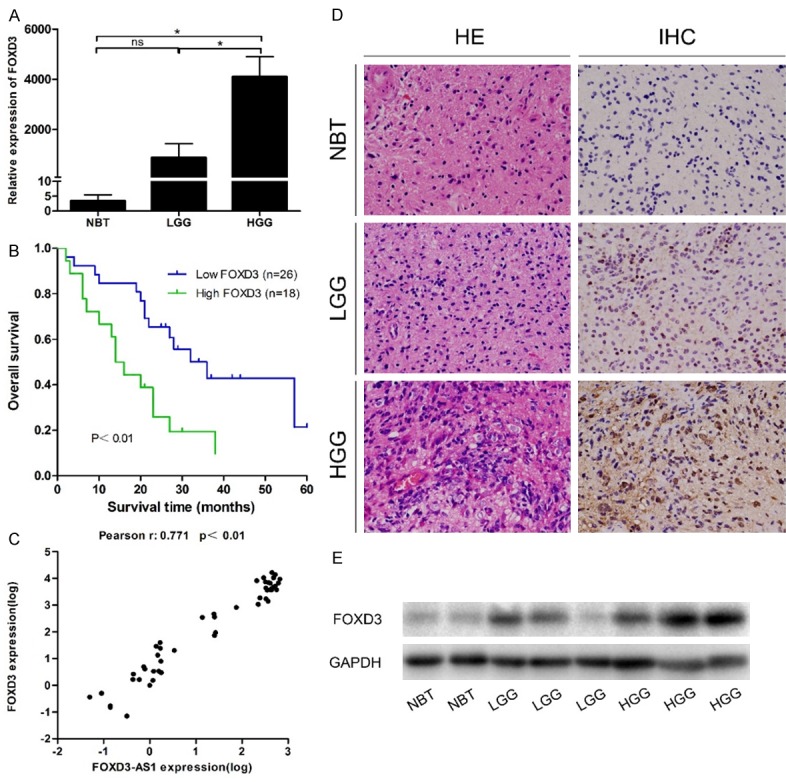
Figure 5.

The expression levels of FOXD3 in the aforementioned specimens. A. Real-time PCR revealed that FOXD3 expression was significantly higher in the high-grade glioma tissues compared with that in normal brain tissues and low-grade glioma tissues. B. Overall survival of patients with glioma. The survival time of patients with high FOXD3 expression was significantly shorter than that in patients with low FOXD3 expression (P<0.01). C. There was a positive correlation between FOXD3-AS1 expression and FOXD3 expression in normal brain tissues and glioma tissues. D. Hematoxylin eosin (HE) staining was used to observe glioma morphology, and immunohistochemistry (IHC) staining was used to evaluate FOXD3 expression in glioma tissues and normal brain tissues. E. Western blot indicated higher protein levels of FOXD3 in high-grade glioma tissues than those in normal brain tissues and low-grade glioma tissues. ns P>0.05, *P<0.05.
