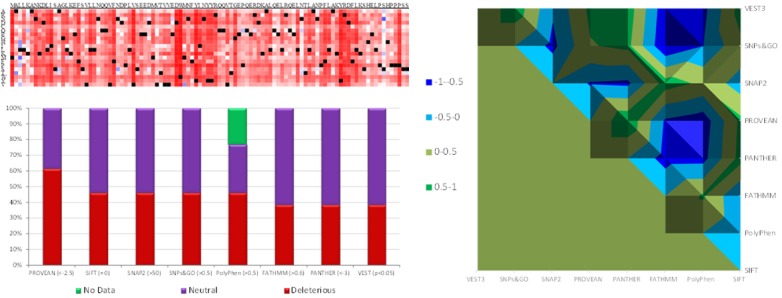
Figure 1.

Heatmap of AHSP protein. Top Left: Heatmap of AHSP protein generated using SNAP2. Dark red: Strong signal for high level pathogenicity. Bottom Left: Pathogenicity of nsSNPs in the predicted using various state-of-art-tools. A value in the parenthesis indicates the threshold value for pathogenicity. Right: Surface chart of correlation between the predictions of pathogenicity of nsSNPs in AHSP gene by various state-of-art-tools.
