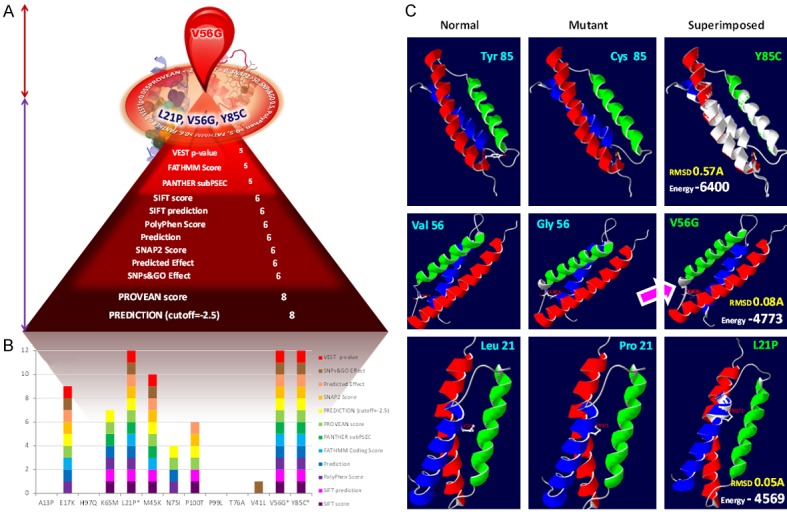
Figure 3.

Graphic illustration of the state of art tools applied for the accurate detection of the highly pathogenic nsSNPs of AHSP gene. A: SNPs on the circle: The most deleterious nsSNPs of ANSP gene agreed consistently by all the state of art tools. Nut brown colored double headed arrow region: Region holds the substitution highly pathogenic as per the structural and protein-protein interaction analysis. Violet colored double headed arrow region: Number of deleterious SNPs by a particular tool. B: Deleterious effect of each substitution. Number of blocks corresponds to the number of tools agreed as deleterious. C: Superimposed models of AHSP normal and mutant. Arrow locates the extra helix due to the V56G mutation in the AHSP gene. Pink arrow indicates the resulted additional helix due to the glycine substitution at the 56th position.
