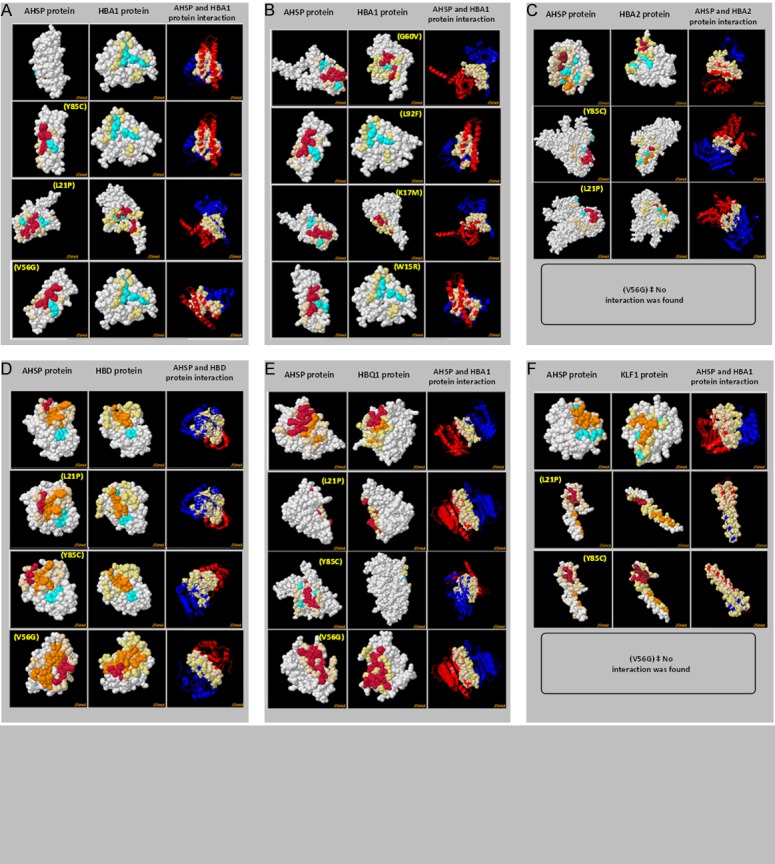
Figure 5.

AHSP protein and globin protein interaction. Colum number 1 of each box indicates the template AHSP protein, column 2 denotes the target globin protein and text in parenthesis indicate the amino acid substitution. Column number 3 indicates the complex of the target protein-template protein interaction of the protein in the respective rows. A: Interaction between wild/mutated AHSP and native HBA1. B: Interaction between native AHSP and mutated HBA1. C: Interaction between mutated AHSP and native HBA2. D: Interaction between mutated AHSP and native HBD. E: Interaction between mutated AHSP and native HBQ1. F: Interaction between mutated AHSP and native KLF1.
