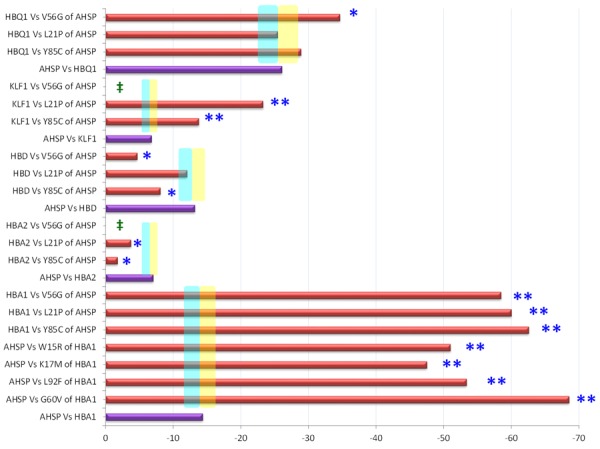
Figure 6.

Binding energy of the template-target protein complex. ‡No interaction was found. *Less significantly at 10% varied binding energy compare to the wild type interaction. Shades colored sky blue and yellow indicates +10% and -10% variation compare to the wild type. **More Significant at >100% varied binding energy.
